


 26 / 44

Ref. No. [UMCES] CBL 2017-050
ACT VS17-05
26
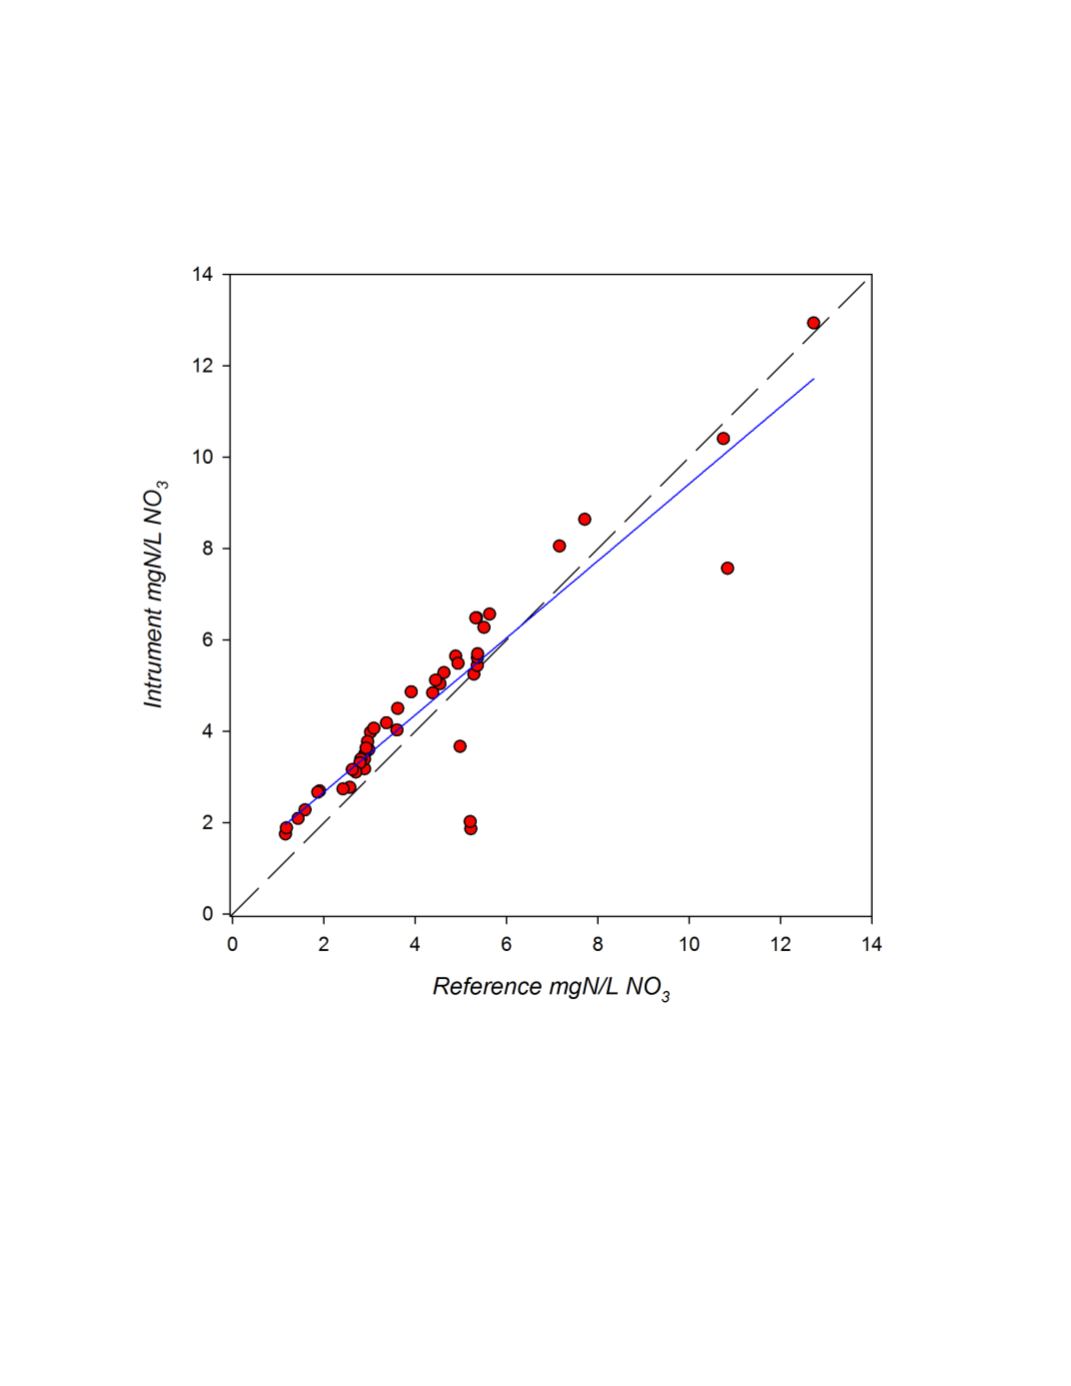
A cross-plot of all matched observations for the deployment is given in figure 11.
A linear
regression of instrument versus reference measurement was highly significant (p<0.0001; r
2
=
0.75) with a slope of 0.96 and intercept of 0.38.
Figure 11.
Maumee River field response plot for the 32 day deployment of the Real-NO3 compared to
reference NO
3
samples. The plotted line represents a 1:1 correspondence, the blue line represents the linear
regression.