


 23 / 44

Ref. No. [UMCES] CBL 2017-050
ACT VS17-05
23
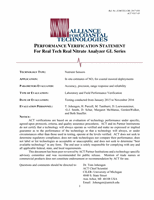
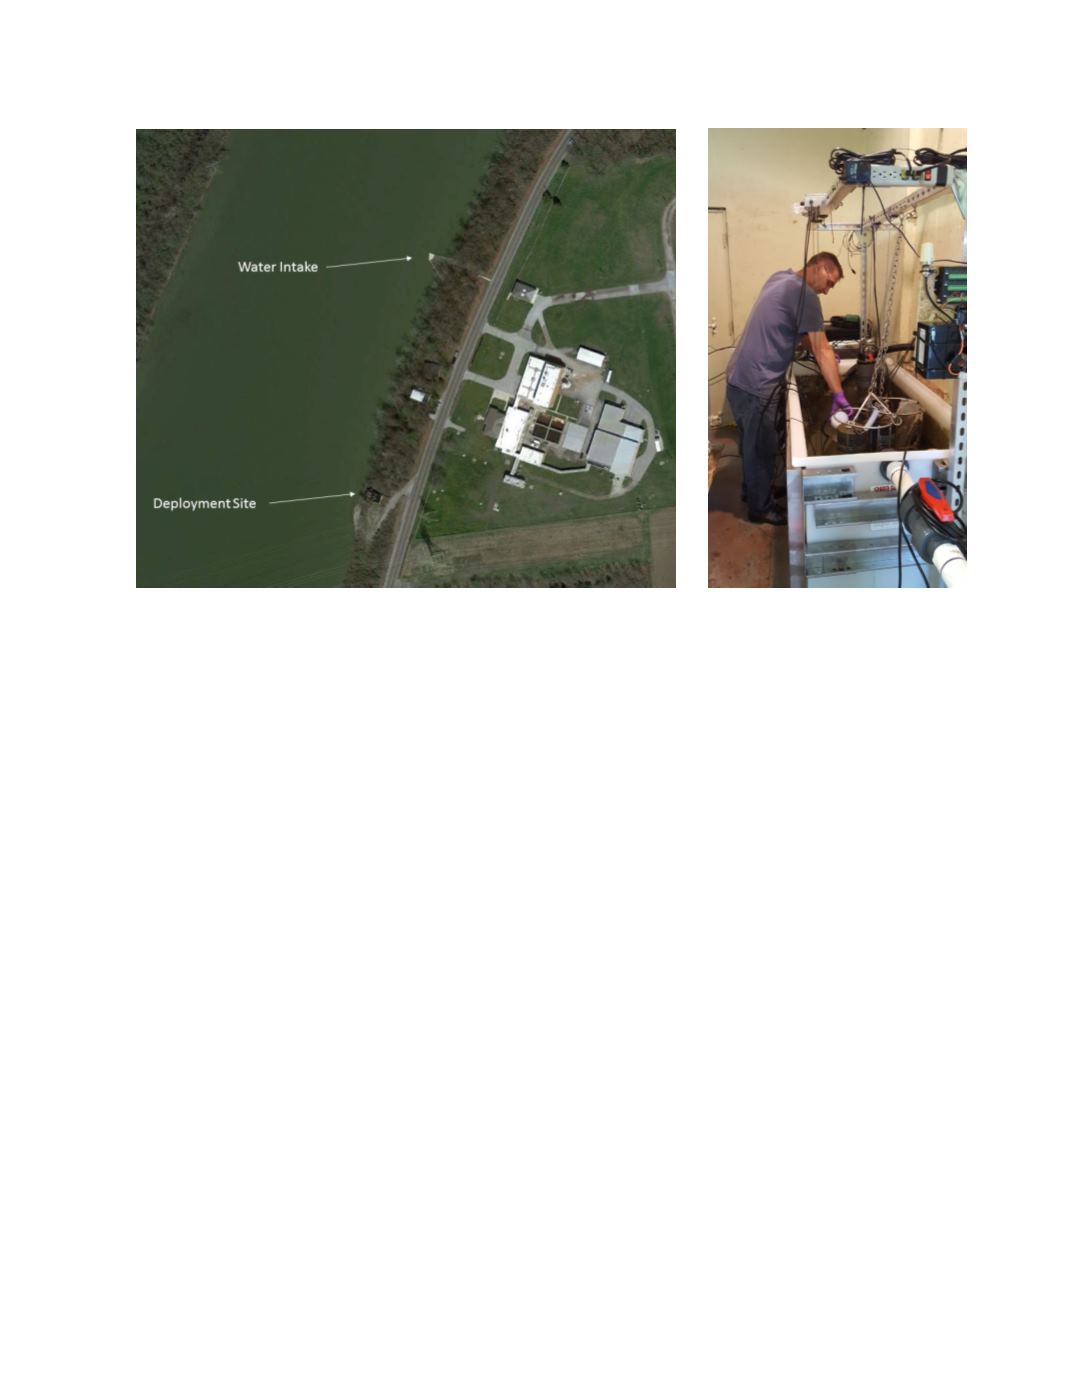
Figure 8.
Aerial view of the Maumee River (left) and the flow through deployment tank (right).
Time series results of ambient conditions for river discharge, temperature, specific
conductivity, turbidity and chlorophyll are given in figure 9. Temperature ranged from 20.5 –
27.7
o
C, specific conductivity from 423 - 689 µS/cm, turbidity from 8 – 681 NTU, and chlorophyll
from 4.5 – 131 µg/L over the duration of the field test.
The Real-NO3 operated successfully during 31 days of the total 32 day deployment
sampling at approximately 5 minute intervals. The instrument shut down on 5/31 and was
rebooted on 6/1 per manufacturer’s instructions resulting in the loss of a day of data. The Real-
NO3 generated 8827 accepted observations out of a possible 9156 for a data completion result of
96.4%. In total, 11 were omitted as outliers due to extreme range (<-0.01 or >25 mgN/L) and 318
values were missing from the inoperable period. Time series results of the Real-NO3
measurements and corresponding reference NO
3
results are given in figure 9 (top panel). NO
3
measured by the Real-NO3 ranged from 0.00 to 19.08 mgN/L compared to a range of 1.16 to 12.72
mgN/L within the reference samples.
The time series of the difference between instrument and reference NO
3
measurements for
each matched pair (n=47 of a possible 51 observations) is given in the bottom panel of figure 10.
Four of the 51 possible comparisons were lost because of missing instrument data. The average
and standard deviation of the measurement difference over the total deployment was 0.312 ± 1.029
mgN/L with a total range of -3.35 to 1.15 mgN/L. There was no significant trend in measurement
difference over time as estimated by linear regression (p= 0.28; r
2
=0.026).