


 21 / 44

Ref. No. [UMCES] CBL 2017-050
ACT VS17-05
21
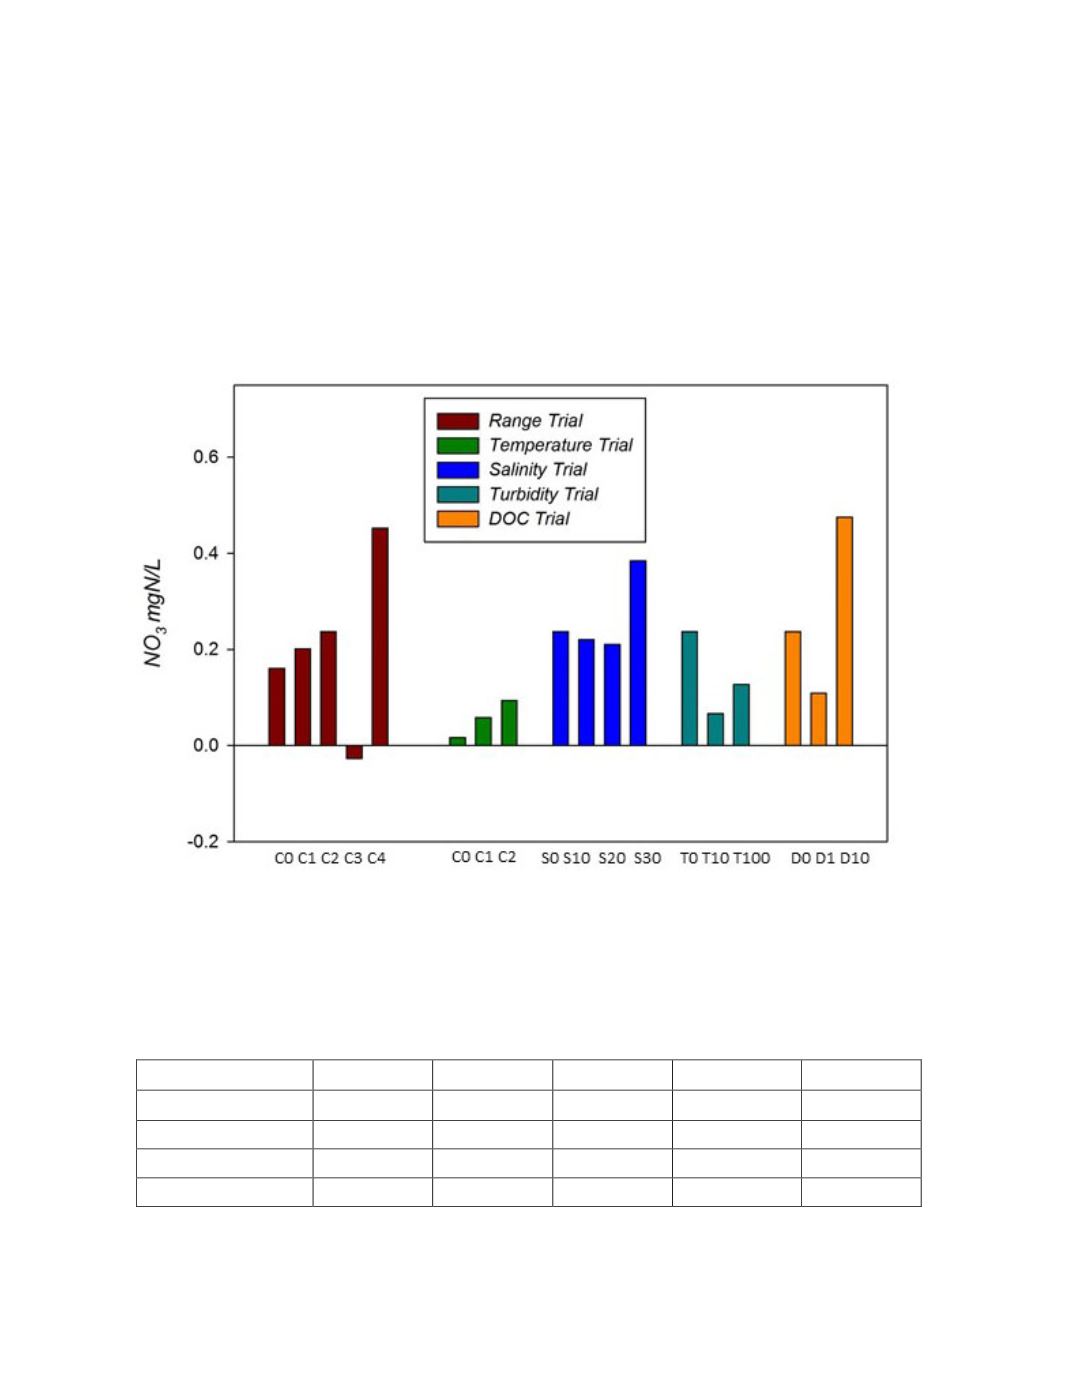
A summary of measurement differences between the Real-NO3 and reference sample for
each trial of each laboratory challenge is presented together in figure 7. With one exception for the
C4 trial in the concentration range challenge the Real-NO3 over-predicted nitrate concentrations
throughout the Laboratory testing. The magnitude of the offset ranged from 0.02 – 0.48 mgN/L.
Measurement difference generally increased in a positive direction with increasing concentration at
both 5 and 20
o
C. Measurement differences also increased at the highest addition levels for
salinity, turbidity, and DOC. Larger offsets occurred for the C3 concentration trial on day 1, which
was used as the ‘zero’ addition level for the matrix challenges, and made it harder to establish
predictable response effects to challenge additions. Results of measurement differences averaged
across all trials within each of the challenge matrices are presented in Table 7.
Figure 7.
Global summary of difference between instrument and reference measurements for all laboratory
tests at each trial conditions for the Real-NO3 analyzer.
Table 7. Measurement differences in mgN/L (min, max, mean, stdev) between instrument and reference
concentrations averaged across all trials within a laboratory challenge.
Real-NO3
Range
Temp
Salinity
Turbidity
DOC
min
-0.0270
0.0166
0.2102
0.0660
0.1089
max
0.4530
0.0935
0.3842
0.1268
0.4751
mean
0.2050
0.0559
0.2717
0.0964
0.2920
stdev
0.1720
0.0385
0.0976
0.0430
0.2589