


 16 / 44

Ref. No. [UMCES] CBL 2017-050
ACT VS17-05
16
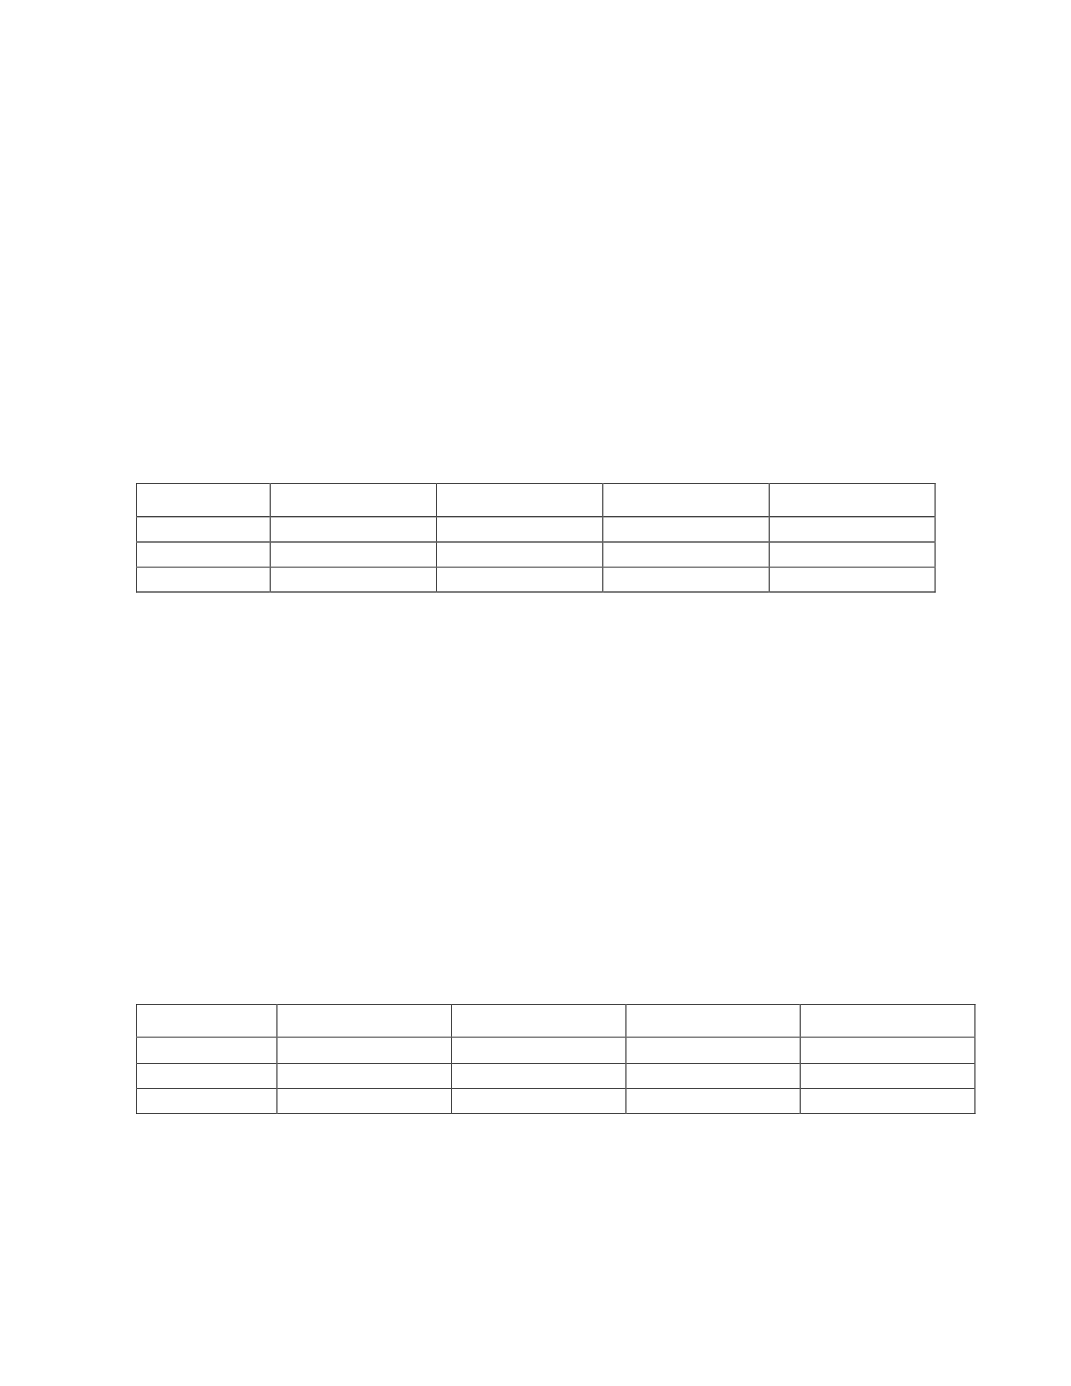
Results of the laboratory turbidity challenge at the C3 concentration level are shown in
figure 5. The absolute difference between instrument and reference measurement across all
timepoints for the two added turbidity levels ranged from 0.028 to 0.135 mgN/L, with a mean of
0.096 ±0.036 mgN/L. The means for each turbidity trial are given in Table 5. Results for the zero
turbidity level are taken from the initial concentration challenge on day 1. The measurement
difference increased positively by a factor of two between the 10 and 100 NTU trials. However
offsets for both trials were substantially lower than the results seen for C3 on day 1 using RO
water. Due to the higher offset in the zero trial, a linear regression of the measurement differences
versus turbidity was significant (p=0.02; r
2
=0.34), with a slope of -0.005 and intercept of 0.209,
however the negative slope contradicts the increased positive offset seen between the two turbidity
addition trials.
Table 5. Summary of accuracy results for turbidity trials assessed by absolute difference (mgN/L) and
percent error between instrument and reference measurements.
Trial
Reference
Real-NO3
Absolute Diff
% Error
0
1.1005
1.3378
0.2373
21.6
10
1.0002
1.0662
0.0660
6.6
100
0.9798
1.1066
0.1268
12.9
Results of the laboratory DOC challenge at the C3 concentration level are shown in figure
6. The absolute difference between instrument and reference measurement across all timepoints
for the two added DOC levels ranged from 0.099 to 0.482 mgN/L, with a mean of 0.292 ±0.193
mgN/L. The means for each of the DOC trials are given in Table 6. Results for the zero DOC
level are taken from the initial concentration challenge on day 1. The measurement difference
increased positively by a factor of four between the 1 and 10 DOC trials. A linear regression of the
measurement differences versus DOC concentration was significant (p=0.008; r
2
=0.43), with a
slope of 0.013 and intercept of 0.118. The measurement offset was 0.37 mgN/L more positive at
10 versus 1 mg/L DOC, and corresponded to a relative error of approximately 48% versus 11%,
respectively.
Table 6. Summary of accuracy results for Laboratory testing assessed by absolute difference (mgN/L) and
percent error between instrument and reference measurements for each individual trial condition within
each matrix challenge.
Trial
Reference
Real-NO3
Absolute Diff
% Error
0
1.1005
1.3378
0.2373
21.6
1
1.0013
1.1102
0.1089
10.9
10
0.9870
1.4621
0.4751
48.1