


 12 / 44

Ref. No. [UMCES] CBL 2017-050
ACT VS17-05
12
RESULTS OF LABORATORY TEST
Accuracy
Real-NO3 measurements and corresponding reference measurements for the lab
concentration range challenge are shown in figure 1. Results for the highest concentration are
excluded from any numerical or statistical comparisons because of its extreme range, but were
included in the test to help identify maximum detection potential. The absolute difference
between instrument and reference measurement across all timepoints for trials C0 – C5 ranged
from -0.217 to 0.490 mgN/L, with a mean of 0.185 ±0.168 mgN/L. The means for each trial are
given in Table 1. A plot of the absolute difference between Real-NO3 and reference measurement
is shown in the bottom panel of figure 1. There was significant trend in instrument offset versus
concentration as estimated by linear regression (p=0.0192; r
2
=0.193). There is no known
explanation for the reversal in measurement offset for the C4 trial. Without that exception Real-
NO3 measurement increasingly over-predicted concentration as test concentrations increased.
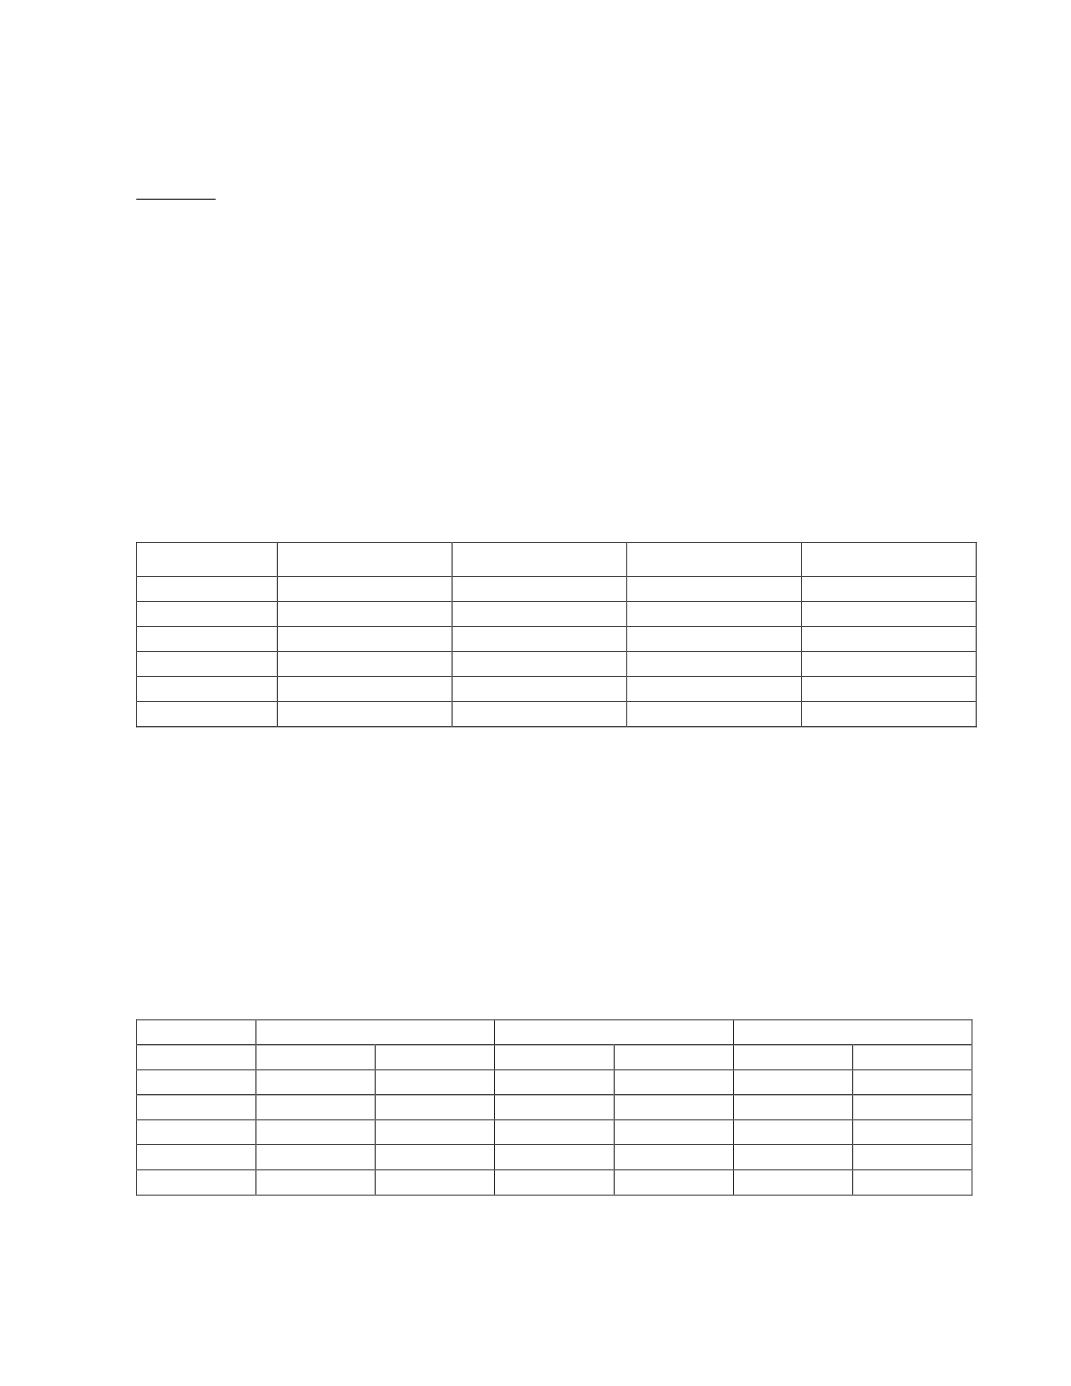
Table 1. Accuracy results for laboratory testing of the Real-NO3 analyzer assessed by absolute difference
(mgN/L) and percent error between instrument and reference measurements for the concentration range test.
Trial
Reference
Real-NO3
Absolute Diff
% Error
C0
0.0224
0.0401
0.0177
78.8
C1
0.0282
0.1887
0.1604
568.2
C2
0.1330
0.3345
0.2015
151.6
C3
1.1005
1.3378
0.2373
21.6
C4
5.6629
5.6358
-0.0270
0.5
C5
4.4573
4.9103
0.4530
10.2
Precision
An assessment of precision was performed by computing the standard deviations and
coefficients of variation of the five replicate measurements for each of the concentration
challenges. The standard deviation of the mean ranged from 0.010 to 0.022 mgN/L across the five
trials, and the coefficient of variation ranged from 0.20 to 6.47 % (Table 2).
Table 2. Precision assessment of the Real-NO3 analyzer during the laboratory concentration range test.
Variance is reported as the standard deviation and coefficient of variation of five replicate measurements
collected at 30 minute intervals in a well-mixed tank maintained at known uniform conditions.
Mean NO
3
(mgN/L)
Standard Deviation
Coefficient of Variation
Trial
Reference
Real-NO3 Reference
Real-NO3 Reference
Real-NO3
C1
0.0282
0.1887
0.0032
0.0122
11.45
6.47
C2
0.1330
0.3345
0.0020
0.0174
1.50
5.21
C3
1.1005
1.3378
0.0087
0.0102
0.79
0.76
C4
5.6629
5.6358
0.1243
0.0113
2.19
0.20
C5
4.4573
4.9103
0.0195
0.0220
0.44
0.45