


 14 / 44

Ref. No. [UMCES] CBL 2017-050
ACT VS17-05
14
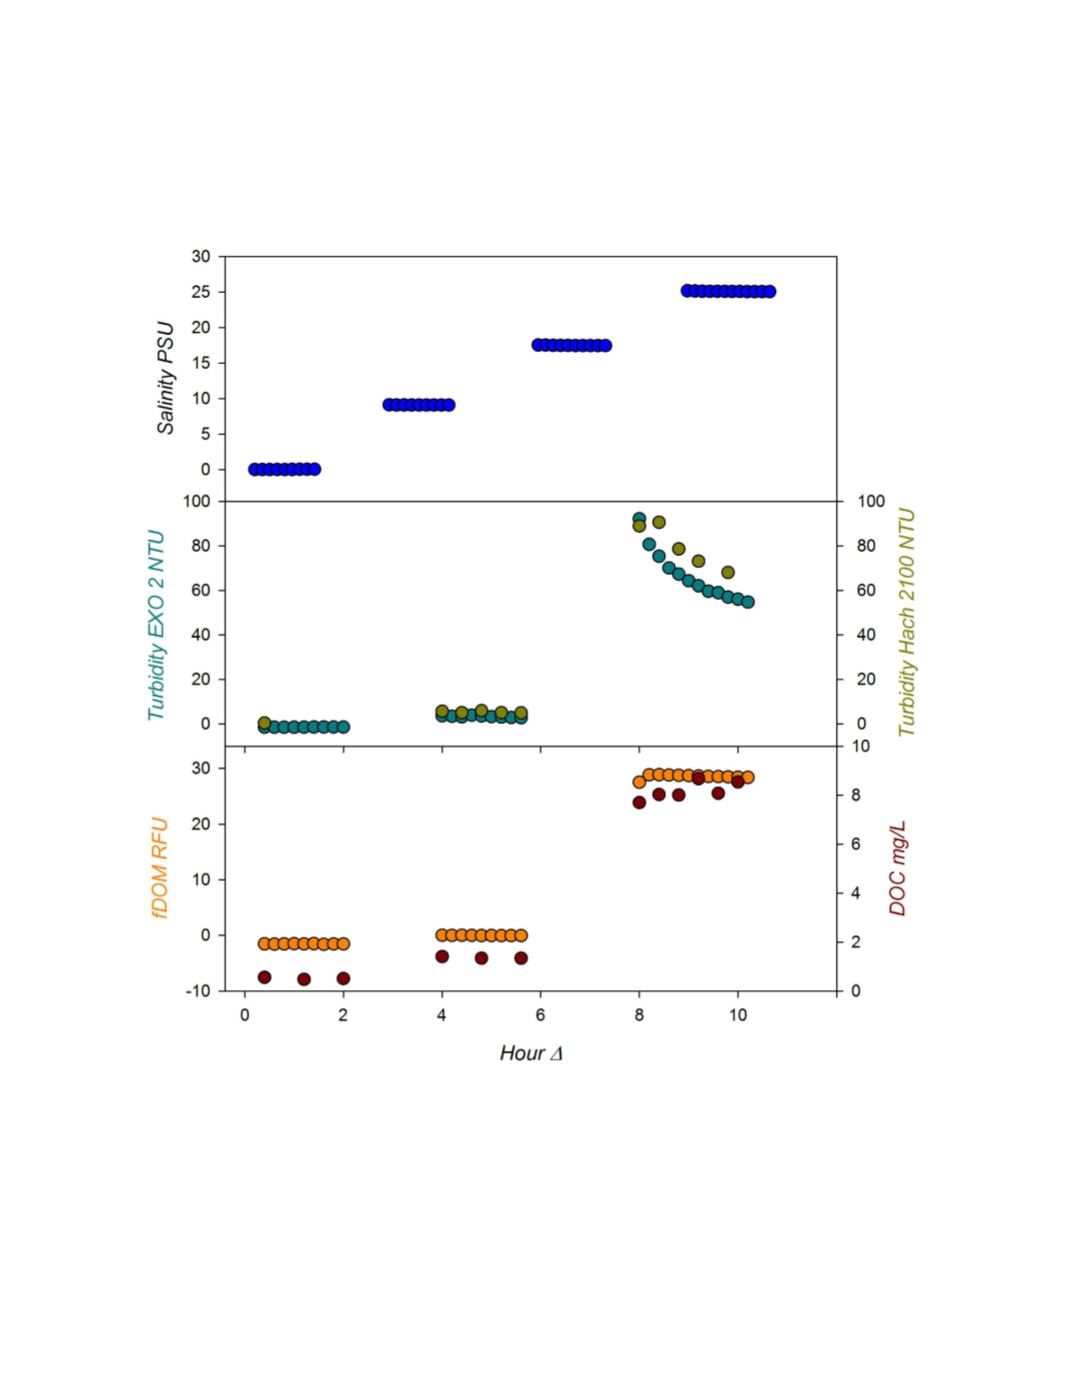
Time series results of ambient water quality conditions for the salinity, turbidity, and DOC
matrix challenges are presented in figure 2. Final test concentrations of turbidity and DOC were
slightly below the stated target levels, and there was noticeable settling of turbidity at the highest
addition level, but confirm the overall challenge conditions being tested.
Figure 2.
Top Panel:
In situ
salinity measured by EXO2 sonde in the laboratory salinity challenge
covering ambient plus 3 salinity ranges.
Middle Panel:
In situ
turbidity measured by EXO2 sonde
(teal) and on grab samples by a Hach 2100 Turbidimeter (olive) during the laboratory turbidity
challenge covering ambient plus 2 additions.
Bottom Panel: In situ
fDOM measured by EXO2
sonde (orange) and DOC of discrete samples (dark red) during the DOC challenge covering
ambient plus 2 additions.