


 15 / 44

Ref. No. [UMCES] CBL 2017-050
ACT VS17-05
15
Results of the laboratory temperature challenge at 5
o
C are shown in figure 3. The absolute
difference between instrument and reference measurement across all timepoints for trials C2 – C4
ranged from -0.0880 to 0.4381 mgN/L, with a mean of 0.056 ±0.115 mgN/L. The means for each
trial are given in Table 3. Measurement differences at both C2 and C3 were significantly lower at
5
o
C (0.017 and 0.058) versus 20
o
C (0.020 and 0.237) (p<0.01). Differences were not statistically
significant across temperatures at the C4 level. Similar to test results at 20
o
C, the measurement
offset increased in a positive direction as concentration increased during the 5
o
C test.
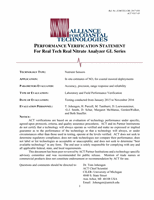
Table 3. Summary of accuracy results for temperature trials assessed by absolute difference (mgN/L) and
percent error between instrument and reference measurements.
Trial
Reference
Real-NO3
Absolute Diff
% Error
C2
0.1162
0.1328
0.0166
14.3
C3
1.0627
1.1203
0.0576
5.4
C4
5.4630
5.5565
0.0935
1.7
Results of the laboratory salinity challenge at the C3 concentration level are shown in
figure 4. The absolute difference between instrument and reference measurement across all
timepoints for the three added salinity levels ranged from 0.146 to 0.483 mgN/L, with a mean of
0.272 ±0.095 mgN/L. The means for each salinity trial are given in Table 4. The zero salinity
results are taken from the initial concentration challenge on day 1. There was a significant increase
in measurement offset (more positive) at a salinity of 30, whereas differences were quite similar at
the 0, 10, and 20 salinity levels. A linear regression of the measurement differences versus salinity
was significant (p=0.004; r
2
=0.38) with a slope of 0.005 and intercept of 0.184, clearly reflecting
the strong difference for the salinity 30 test. The average offset at salinity 30 was around 0.16
mgN/L higher than the average for the other trials, which corresponded to a doubling of the
relative error to nearly 42%.
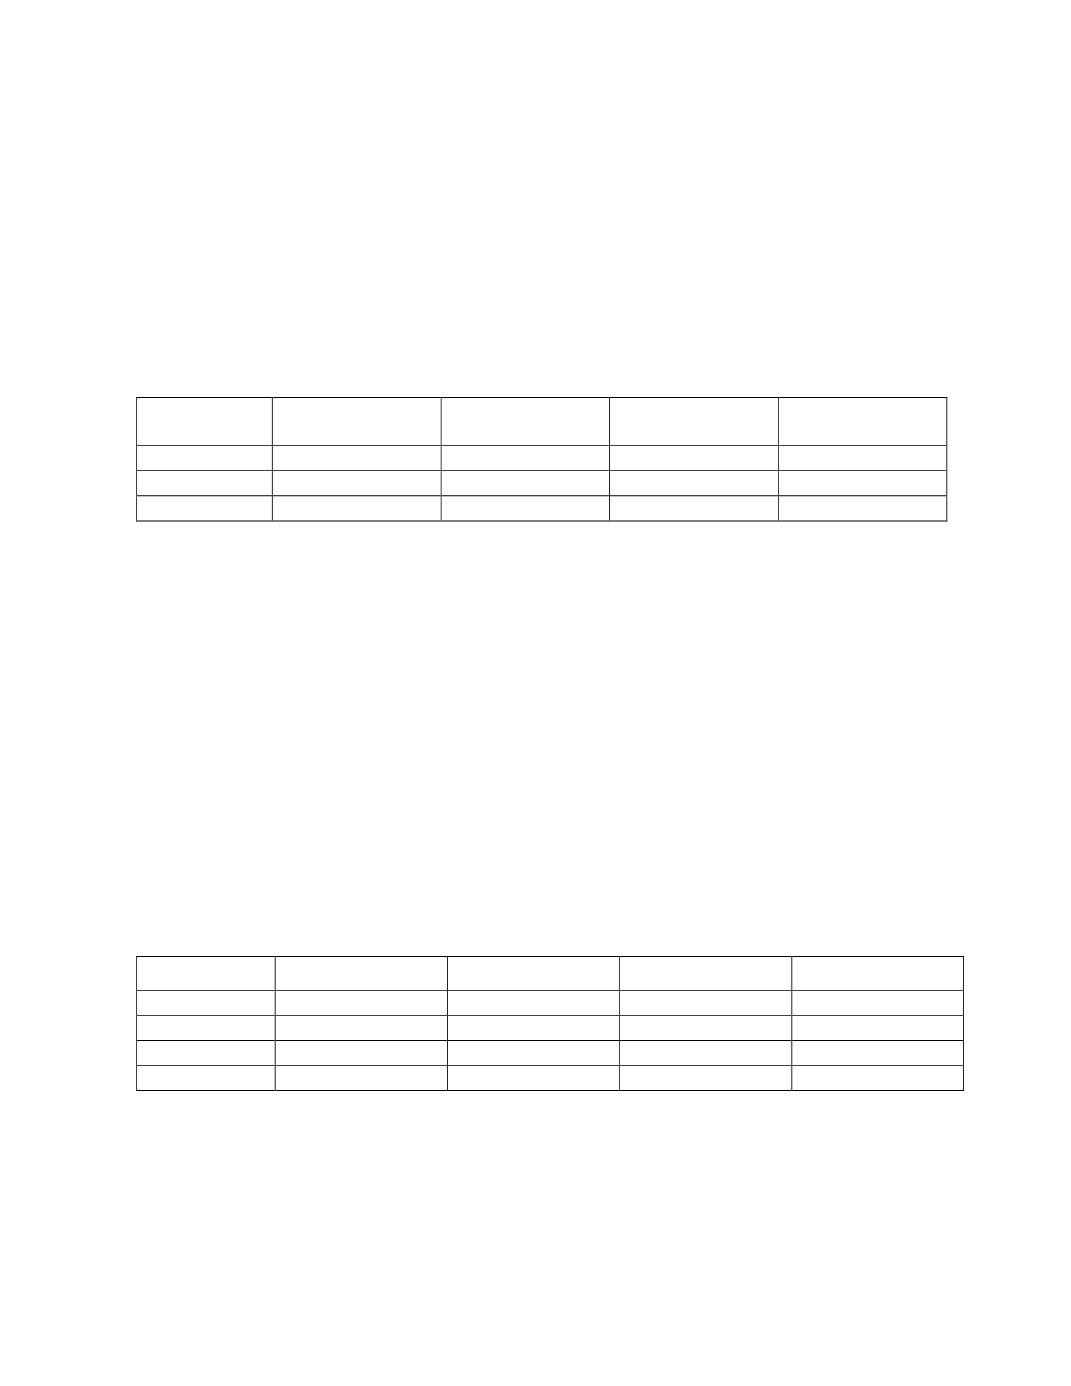
Table 4. Summary of accuracy results for salinity trial assessed by absolute difference (mgN/L) and percent
error between instrument and reference measurements.
Trial
Reference
Real-NO3
Absolute Diff
% Error
0
1.1005
1.3378
0.2373
21.6
10
0.9358
1.1565
0.2207
23.6
20
1.0227
1.2329
0.2102
20.6
30
0.9222
1.3064
0.3842
41.7