


 19 / 44

Ref. No. [UMCES] CBL 2017-050
ACT VS17-05
19
Lab Turbidity Challenge
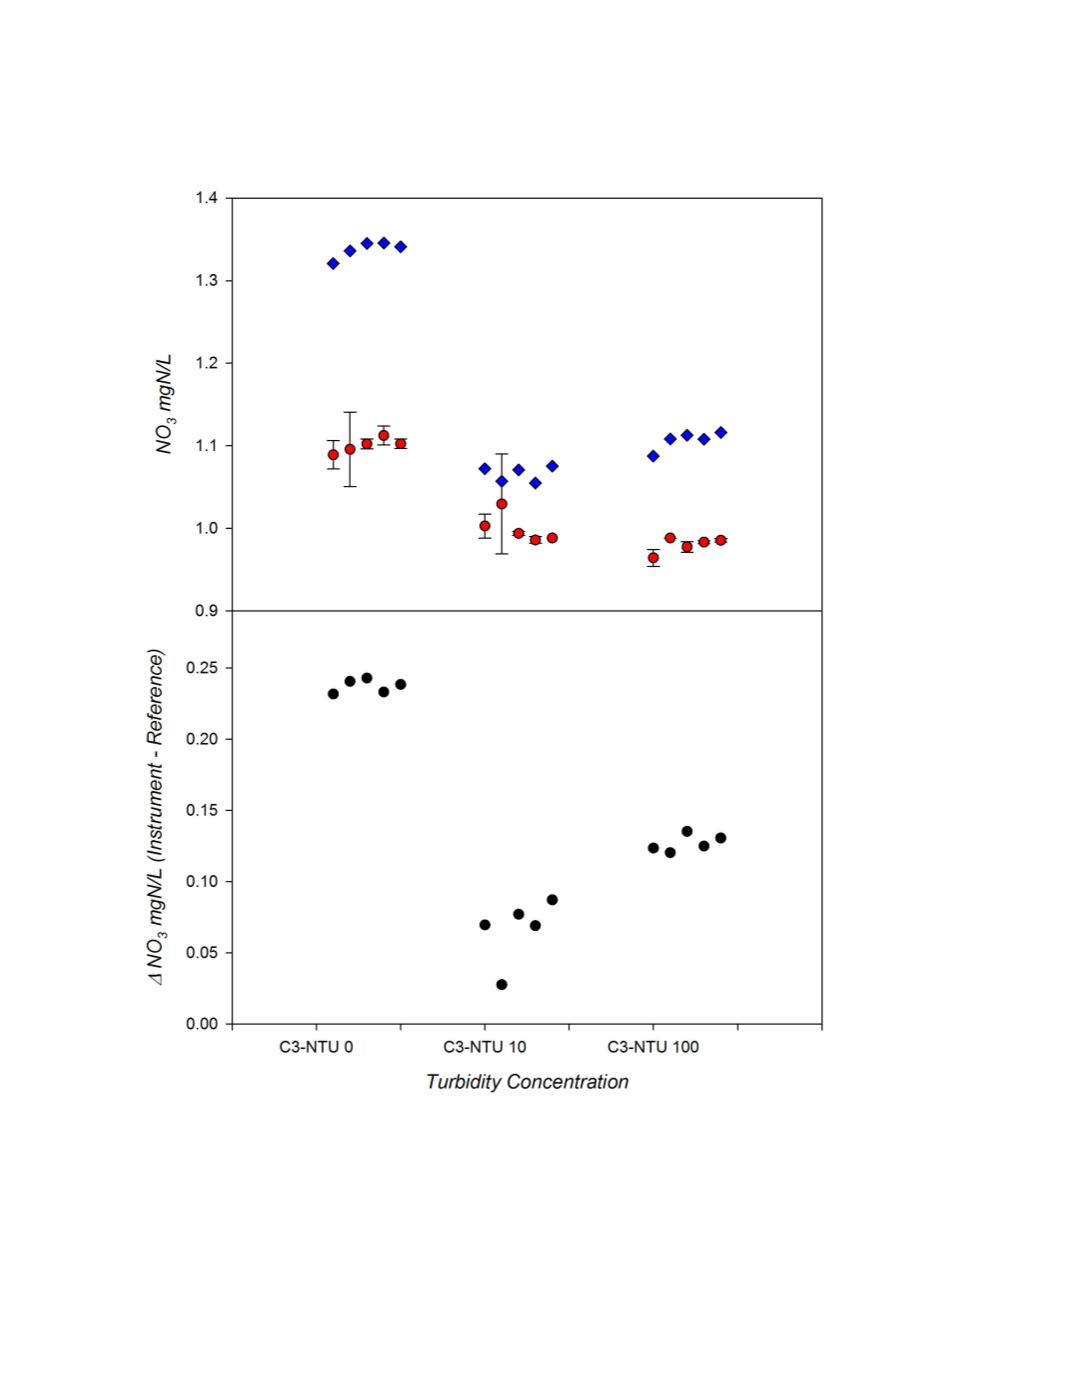
Figure 5.
Top Panel:
Plot
of instrument (blue dots) and reference (red dots) measurements of NO
3
(mgN/L)
at three turbidity levels for the C3 concentration. Five replicate measurements were made at each
concentration level.
Bottom Panel:
Plot of the absolute difference between Real-NO3 and reference
measurement.