


 24 / 44

Ref. No. [UMCES] CBL 2017-050
ACT VS17-05
24
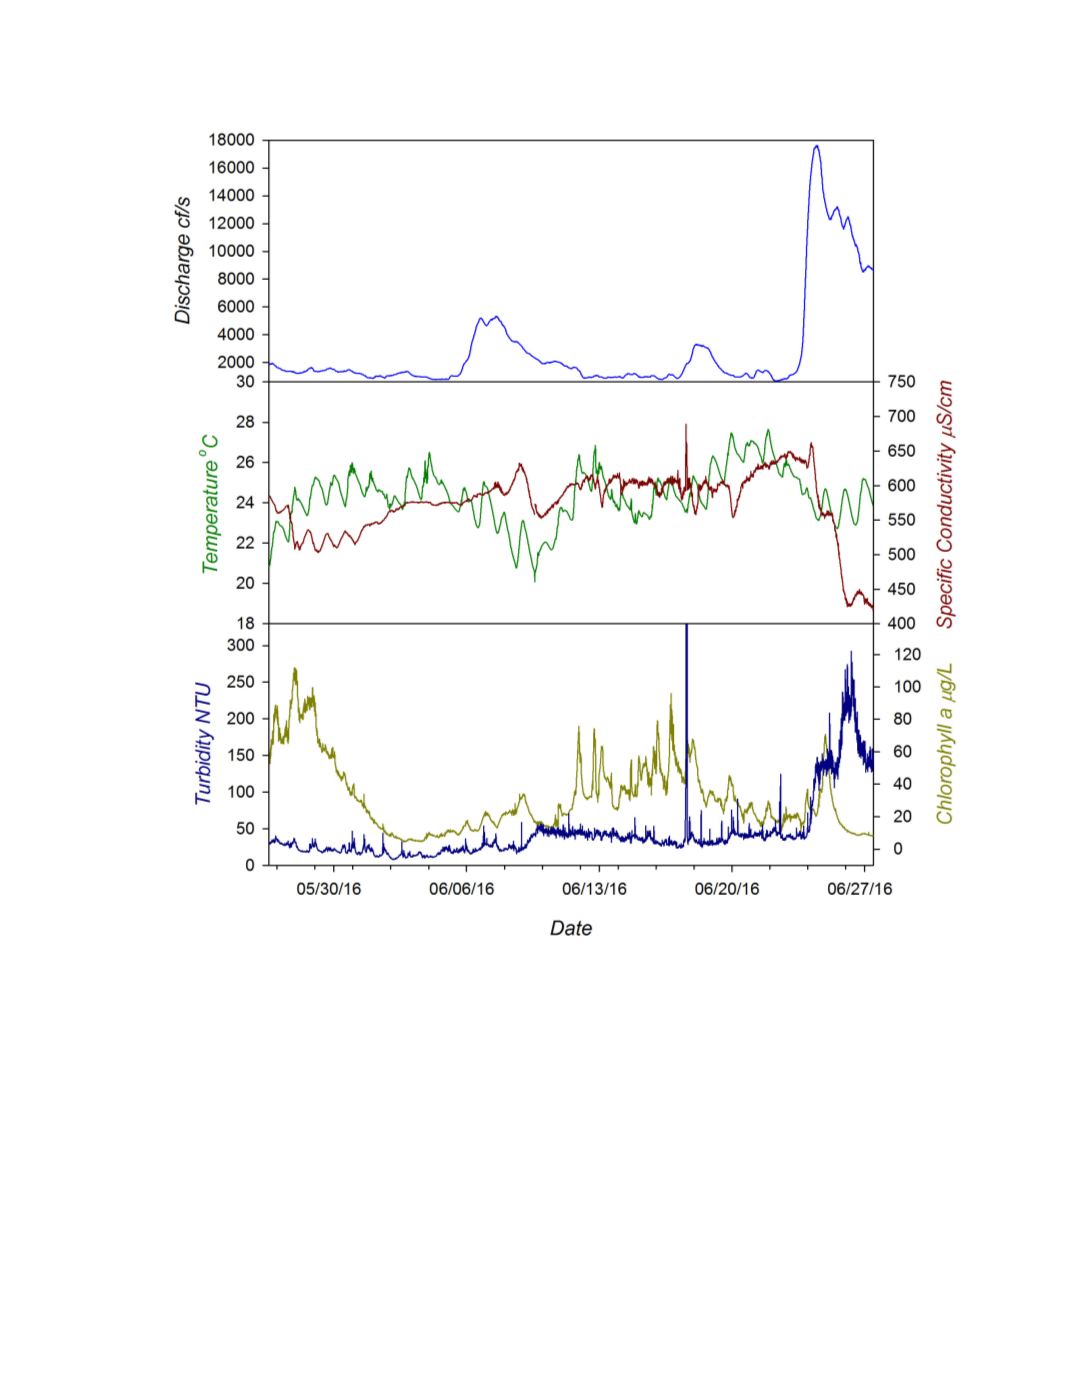
Figure 9.
Environmental conditions encountered during the 32 day freshwater deployment in the Maumee
River at Waterville, OH.
Top Panel:
Variation in river discharge over the term of the deployment.
Middle
Panel:
Variation in temperature (green) and Conductivity (red) at the depth of the sensors, measured by an
EXO 2 Sonde.
Bottom Panel:
Time series of turbidity (blue) and chlorophyll (dark yellow) as measured by
the EXO 2 Sonde. The large spike in turbidity (681 NTU) was produced during a nutrient addition test when
sediment accumulated on the bottom was stirred up from additional mixing of the tank.