


 30 / 44

Ref. No. [UMCES] CBL 2017-050
ACT VS17-05
30
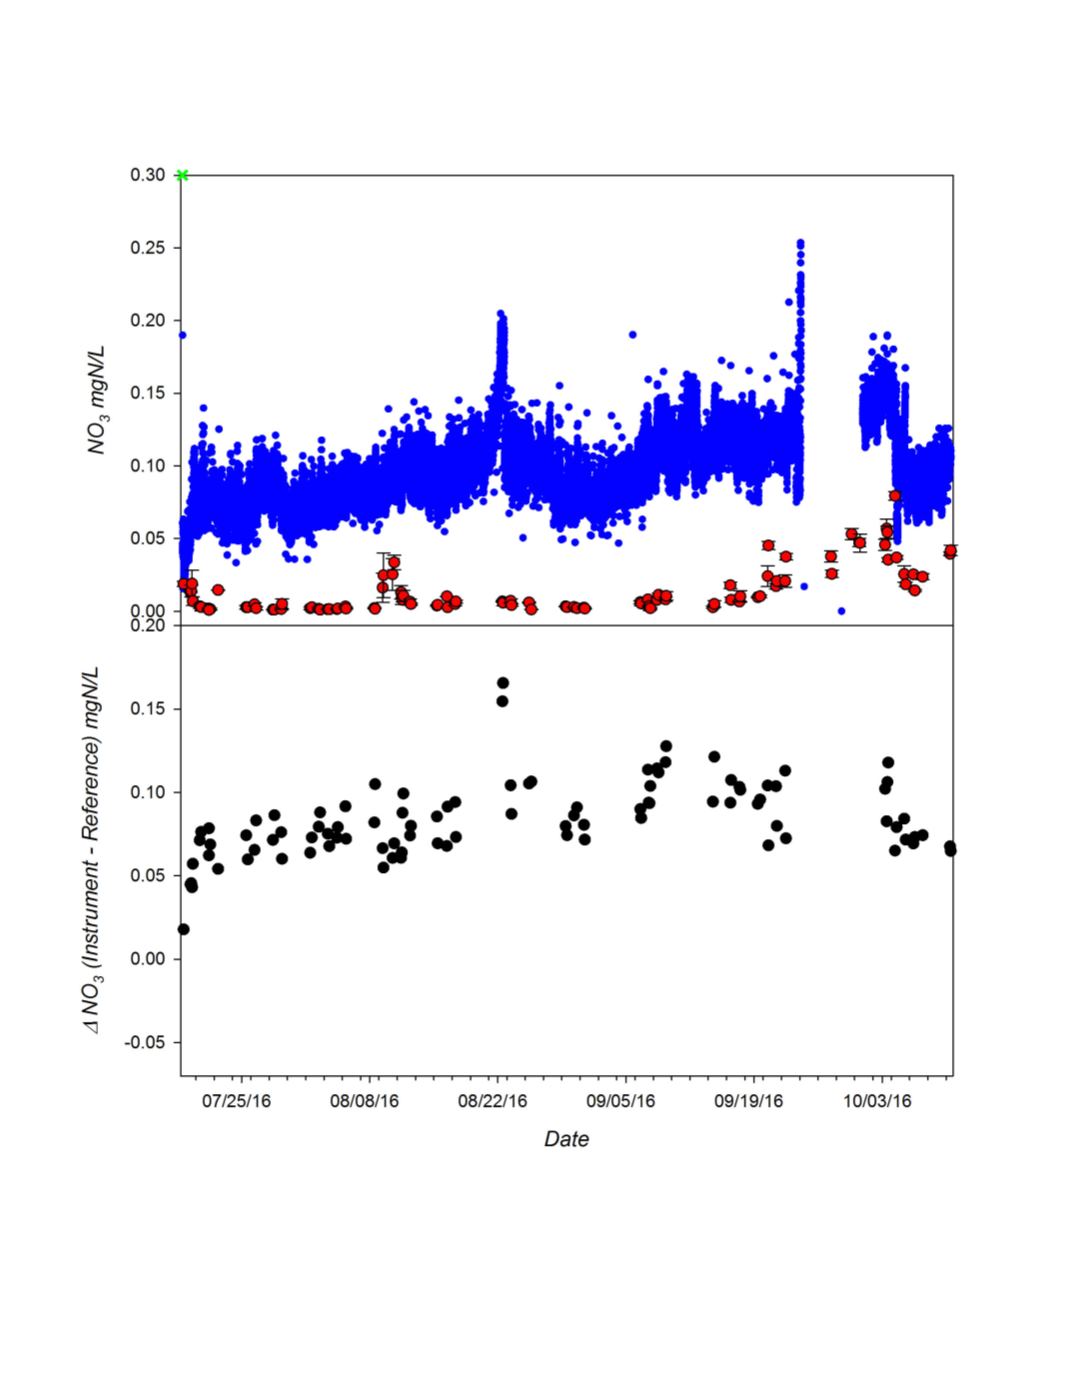
Figure 15.
Time series of NO
3
measured by the Real-NO3 during the 84 day CBL field trial.
Top Panel
:
Continuous NO
3
recordings from instrument (blue circles) and NO
3
of adjacent grab samples (red circles).
Bottom Panel
: The difference in measured NO
3
relative to reference samples (Instrument mgN/L –
Reference mgN/L) observed during deployment.