


 31 / 44

Ref. No. [UMCES] CBL 2017-050
ACT VS17-05
31
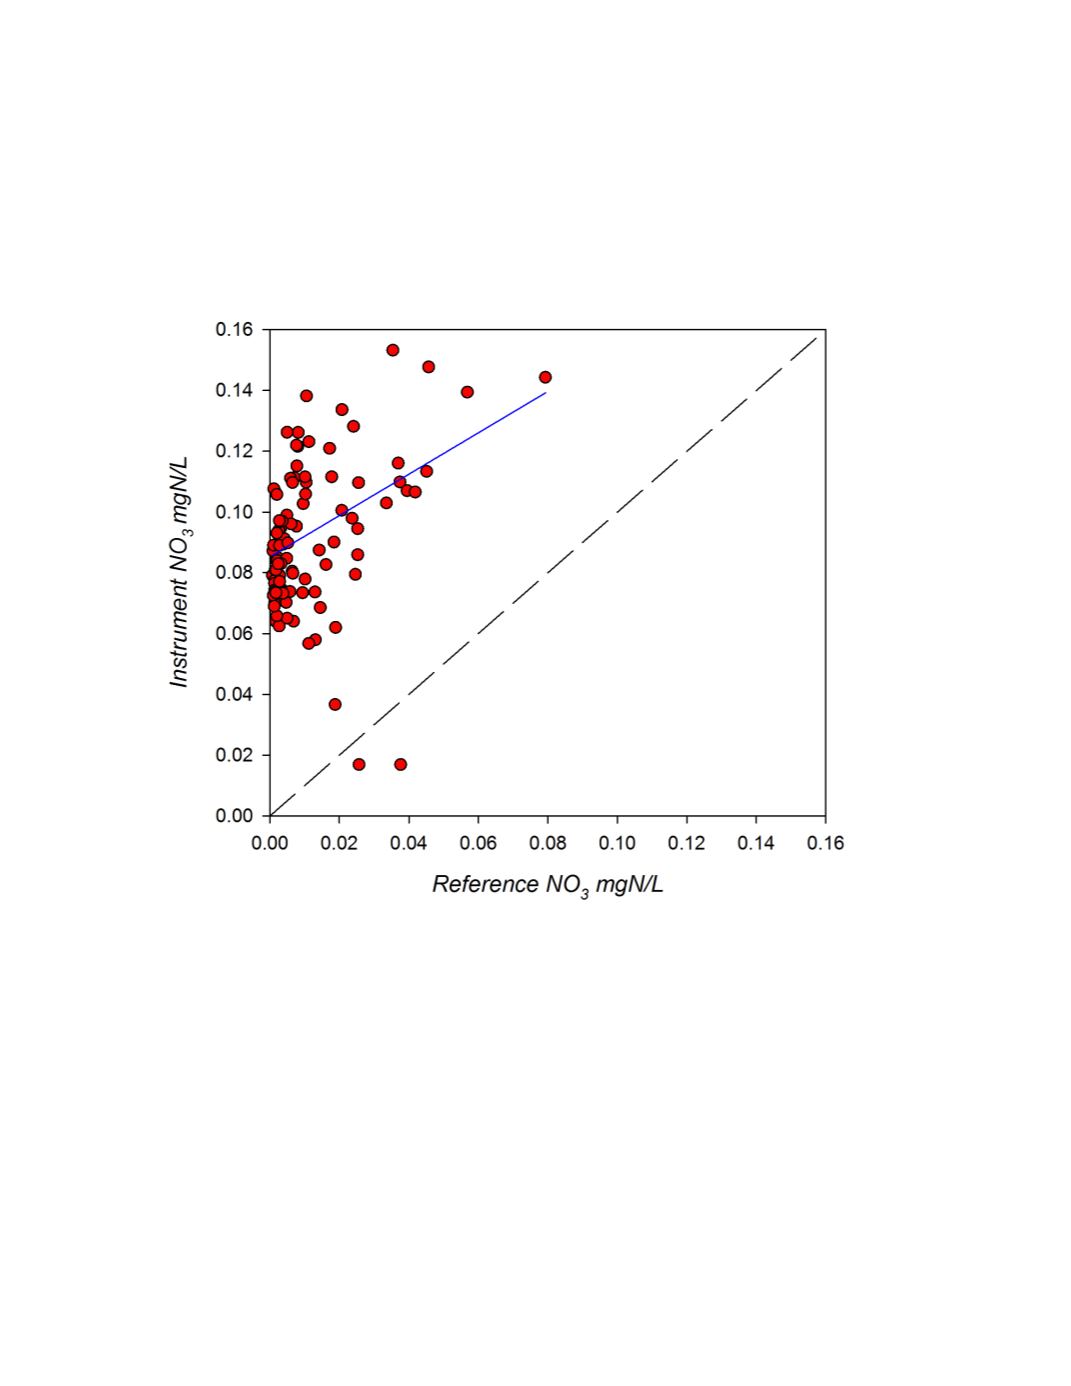
A cross-plot of the matched observations for the deployment is given in figure 16. A linear
regression of the data was significant (p=0.0002; r
2
= 0.132), with a slope of 0.680 and intercept of
0.085. For the calibration set-up at this field test, the Real-NO3 significantly over-predicted
concentrations.
Figure 16.
CBL field response plot for Real-NO3 compared to reference NO
3
samples. The plotted line
represents a 1:1 correspondence, the blue line represents the linear regression.