


 35 / 44

Ref. No. [UMCES] CBL 2017-050
ACT VS17-05
35
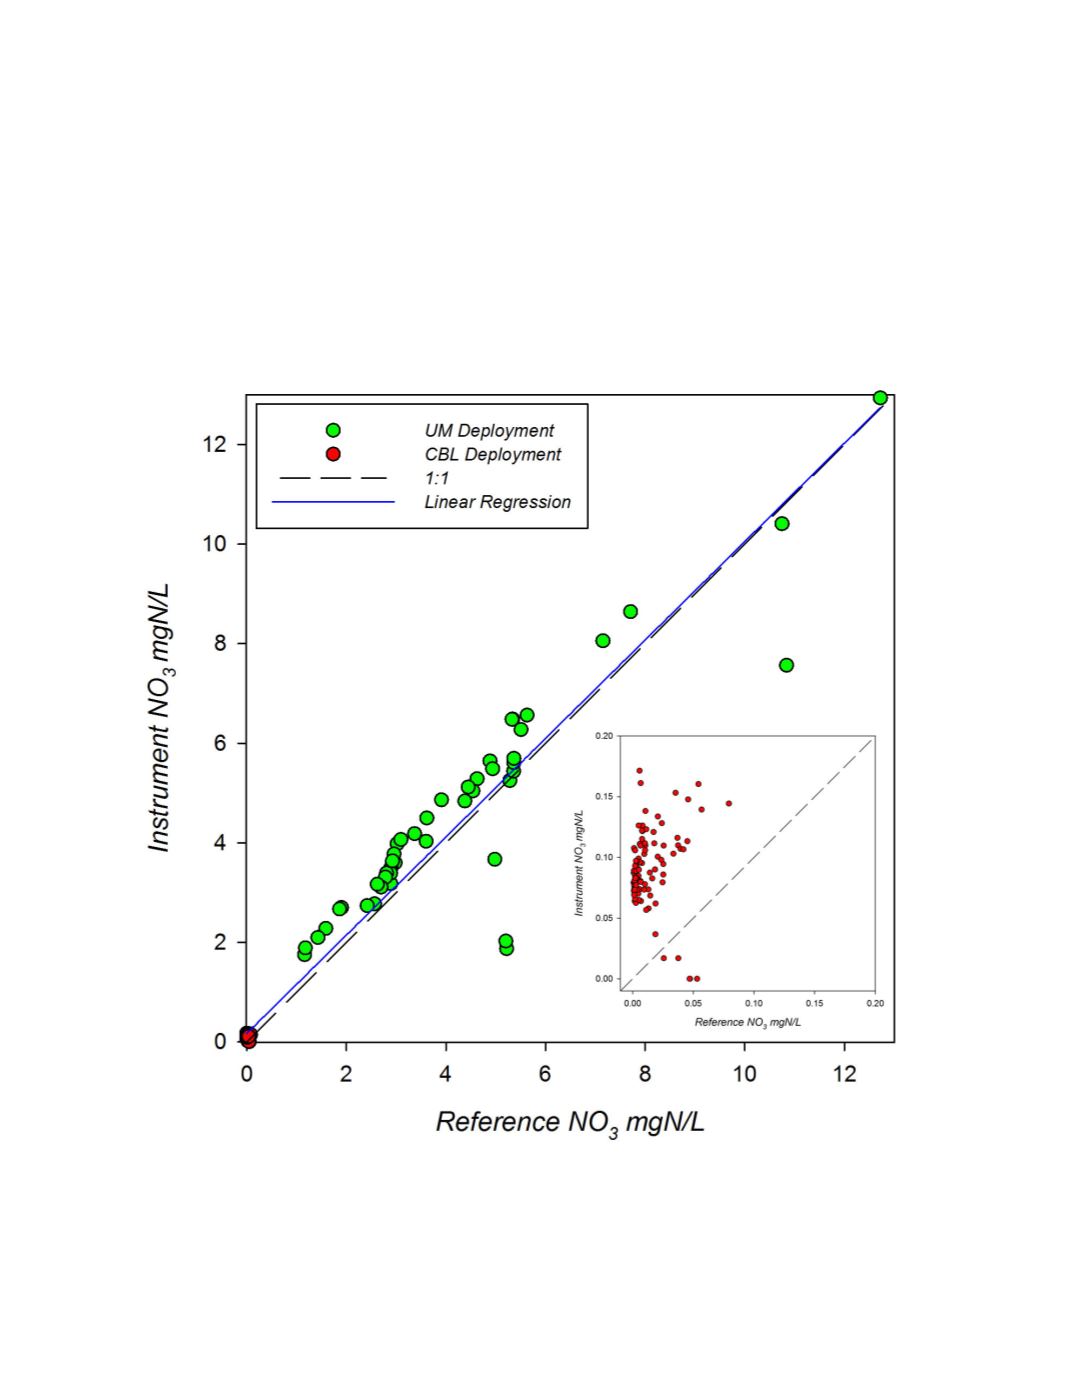
A global summary of instrument versus reference readings for the two field deployment
sites are plotted in figure 20. The Real-NO3 response showed good linearity for the Maumee
River deployment, with higher variability and a noted offset for the brackish test in Chesapeake
Bay (see insert). Due to the spread generated within the Maumee River test, a linear regression of
instrument and reference measurements for the two field tests combined was highly significant
(p<0.0001; r
2
= 0.94) with a slope of 0.99 and intercept of 0.167. The data comparison across the
two field tests covered a concentration range of 0.007 to 12.7 mgN/L.
Figure 20.
Global response plot for the Real-NO3 observed during the three ACT field trials. Insert shows
the CBL and HIMB deployments enlarged. Black dotted line represents a 1:1 correspondence, the blue line
represents the linear regression.