
Ref. No. [UMCES] CBL 2017-050
ACT VS17-05
28
Deployment at Chesapeake Biological Laboratory (CBL)
An 84 day moored field test was conducted in Chesapeake Bay from July 18 to October 10,
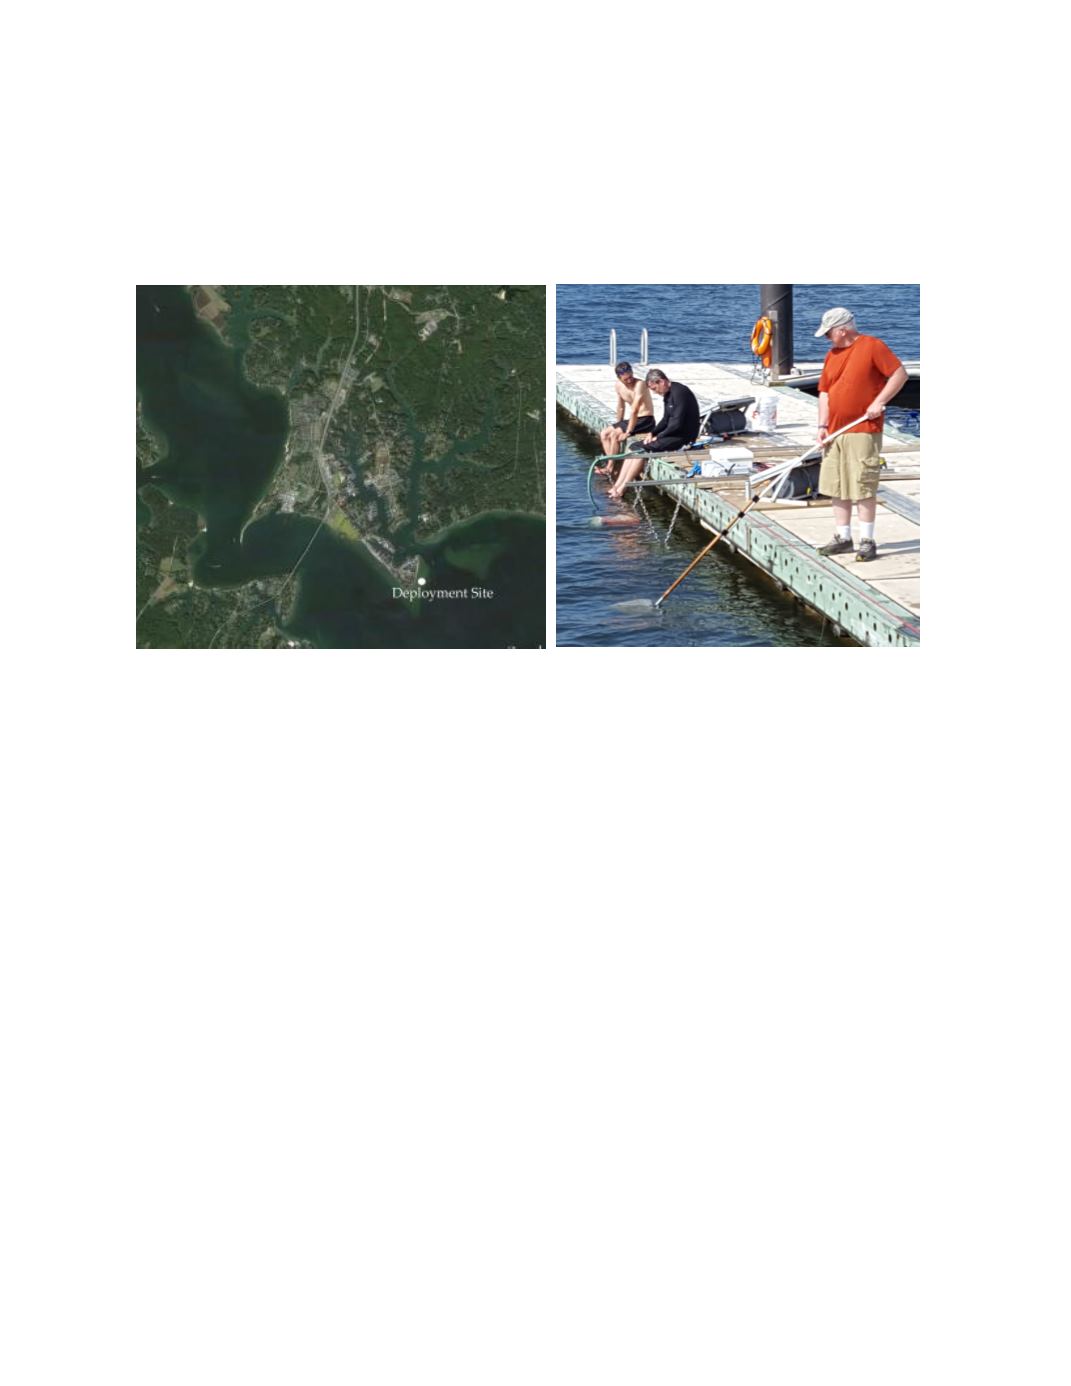
2016. The deployment was located at 38.32°N, 76.45°W attached to the side of a floating pier at
the mouth of the Patuxent River (Figure 13.) The site was brackish with an average water depth of
2.2 m at the test site.
Figure 13.
Aerial view of CBL deployment site (left) and instrument deployment rack off the dock during
deployment (right).
Time series results of ambient conditions for tidal height, temperature, salinity, turbidity
and chlorophyll are given in figure 14. Temperature ranged from 20.0 to 31.3°C, salinity from
12.7 to 16.9 PSU, turbidity from 0.5 to 936.3 NTU and chlorophyll from 0.2 to 97.1 µg/L over the
duration of the field test.
The Real-NO3 operated continuously for 69 days until 9/24 when air purge system
malfunctioned. The system was bypassed per manufacturer’s instructions and the instrument
restarted on 9/30. The instrument returned 22,345 observations out of a possible 24,144 based on
approximate 5 minute sampling intervals for a data completion rate of 93%. For the entire
deployment, 1796 data points were missing, and 3 were flagged as bad. Time series results of the
Real-NO3 and corresponding reference NO
3
results are given in figure 15 (top panel). For the
interval deployed, the range of accepted values reported by the Real-NO3 was 0.000 to 0.254
mgN/L, compared to 0.001 to 0.038 mgN/L within reference samples.
The bottom panel of figure 14 presents the time series of the difference between the Real-
NO3 and reference NO
3
for each matched pair (n=100 comparisons out of a total of 103 with 3
missing instrument results during the inoperable). The average and standard deviation of the
measurement difference for the deployment was 0.083 ±0.022 mgN/L, with the total range of
differences between 0.018 to 0.166 mgN/L. There no significant trend in measurement difference
over time during the deployment (p=0.681; r
2
=0.002).


