


 25 / 44

Ref. No. [UMCES] CBL 2017-050
ACT VS17-05
25
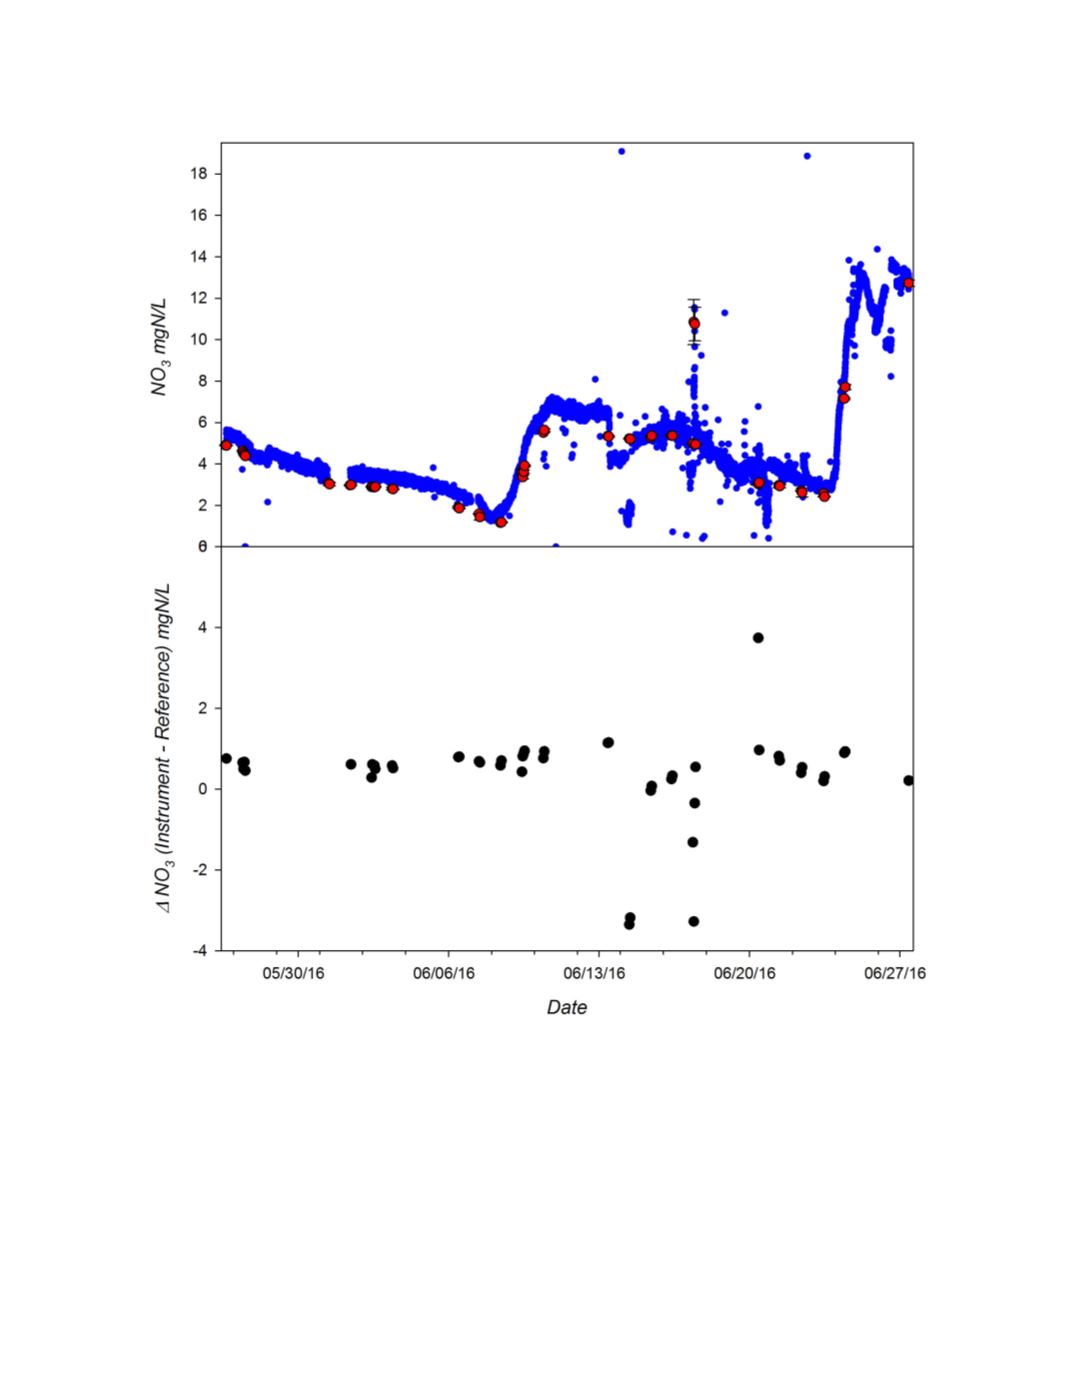
Figure 10.
Top Panel:
Time series plot of the Real-NO3 measurement (blue dots) and reference
measurements (red dots) of nitrate in mgN/L. The green crosses at the top of figure represent flagged data
(not values) and are plotted on the date of occurrence.
Bottom Panel:
Time series plot of the difference
between the Real-NO3 and reference measurements of nitrate in mgN/L (instrument – reference) during the
freshwater deployment in the Maumee River at Waterville, OH.