


 45 / 59

Ref. No. [UMCES] CBL 2016-015
ACT VS16-06
45
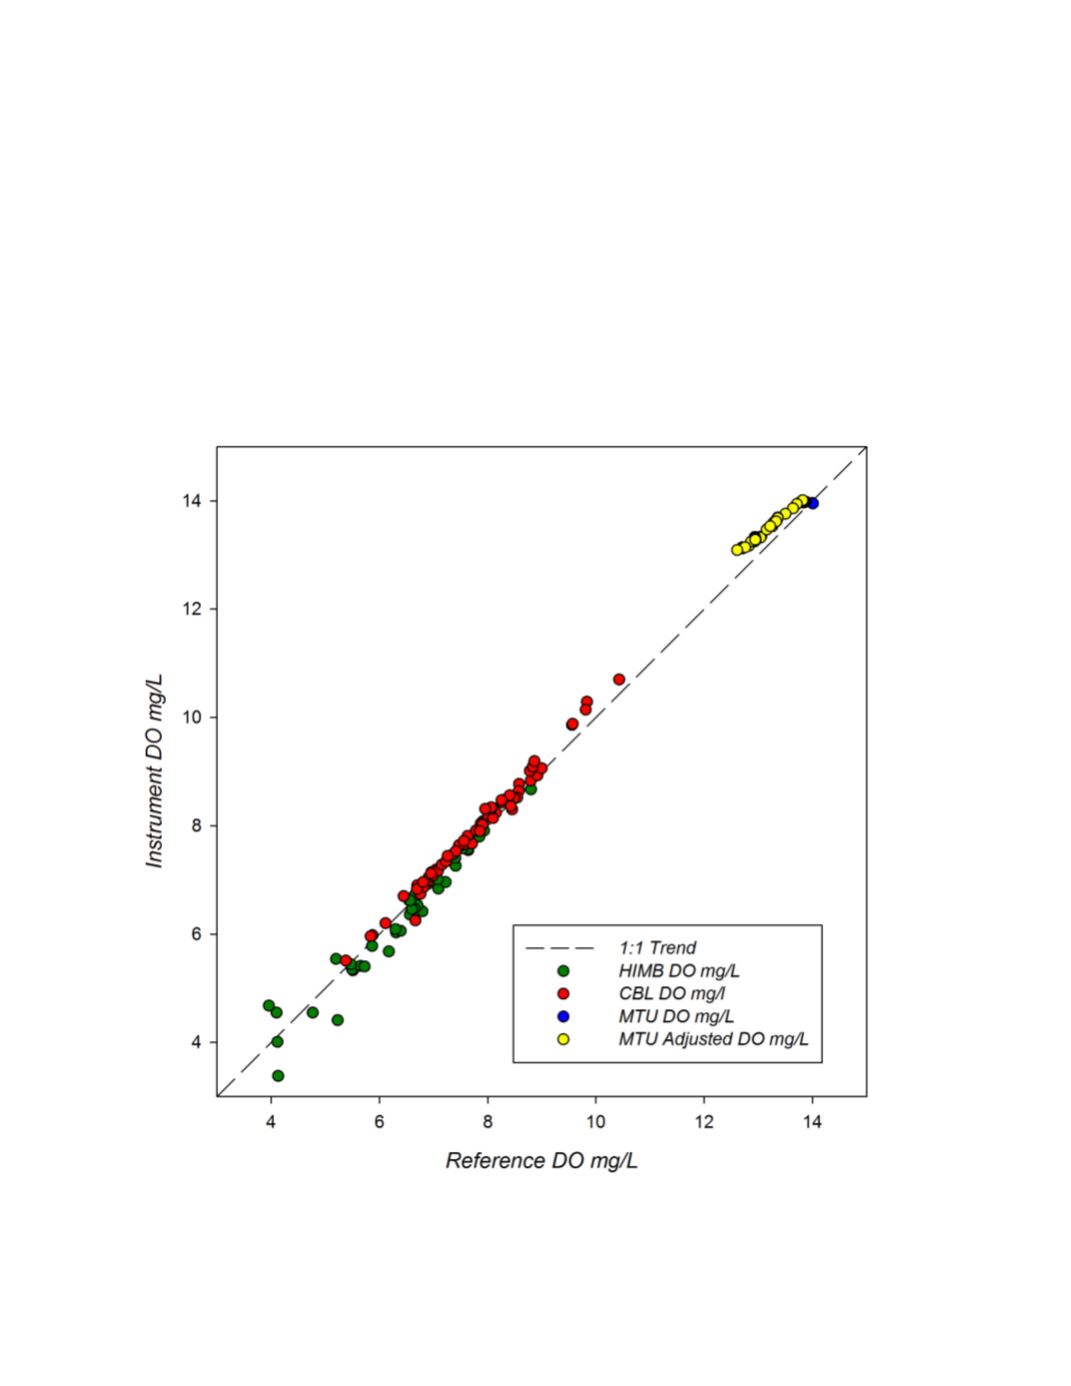
A global summary of instrument versus reference readings for all three field deployment
sites are plotted in figure 10. The EXO2 response showed good linearity across all three
environments including freshwater, brackish water, and oceanic water; but with slightly higher
variability for the oceanic test in Kaneohe Bay. Good agreement between instrument and reference
measurements was observed over the entire range of DO conditions observed varying between 4 to
14 mg/L. A linear regression of the composited data (r
2
= 0.996; p<0.0001)) had a slope of 1.039
and intercept of -0.248.
Figure 10.
Global response plot for the EXO2 instruments observed during the three ACT field trials.
Black dotted line represents a 1:1 correspondence.