


 51 / 59

Ref. No. [UMCES] CBL 2016-015
ACT VS16-06
51
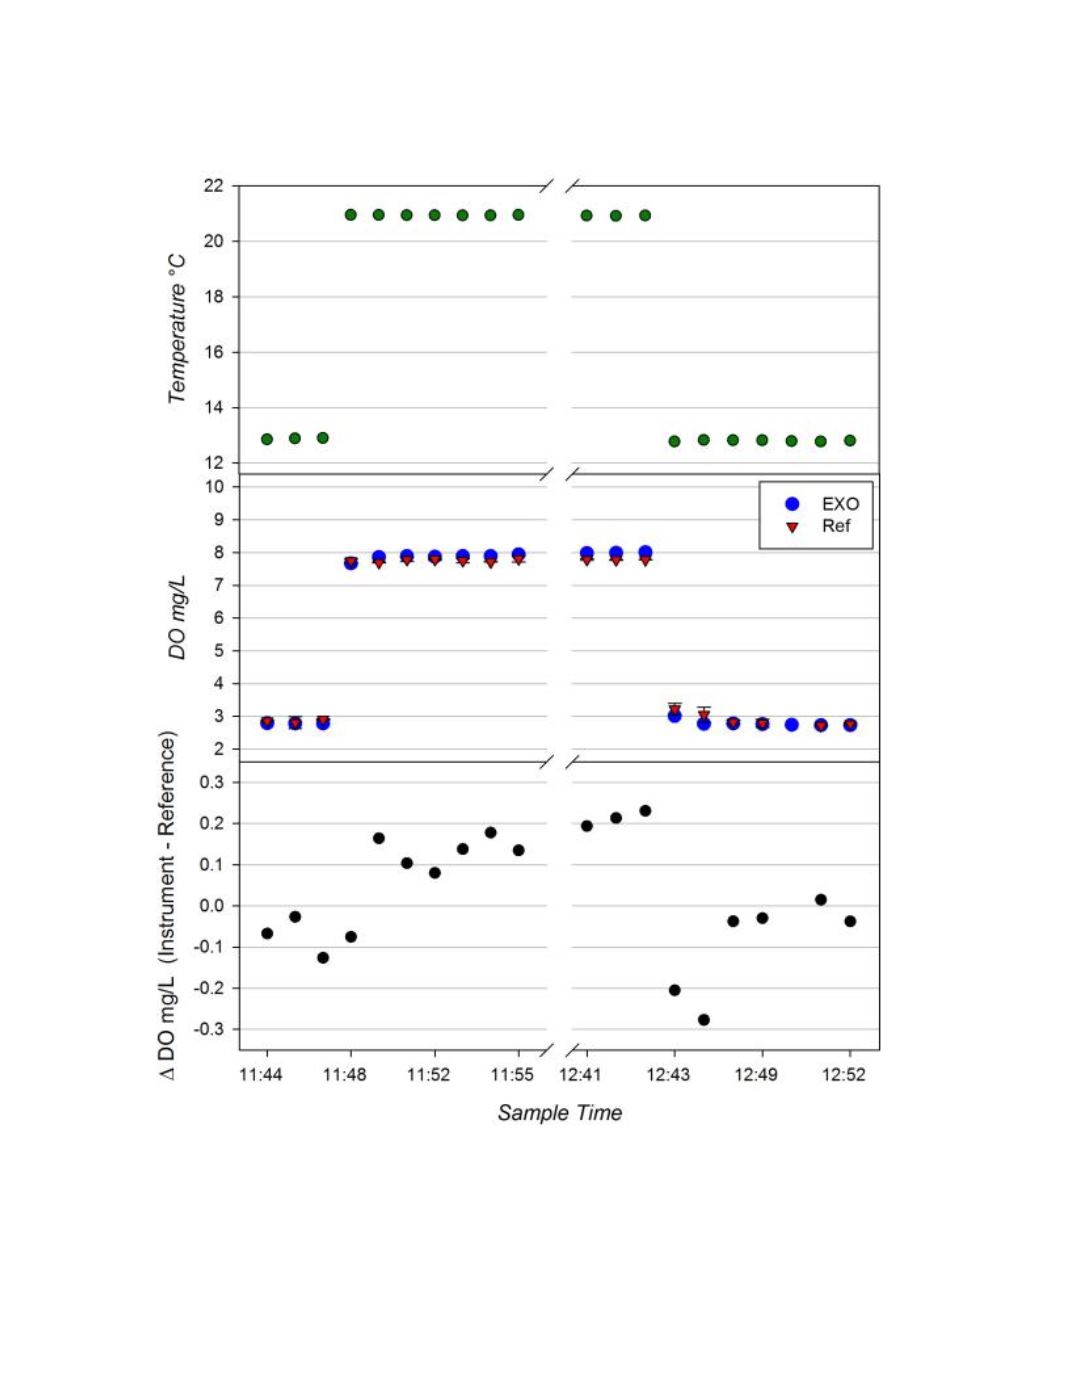
Figure 15. Results of the EXO2 for the Muskegon Lake trials.
Top panel:
EXO2 temperature data at
sample snap.
Middle panel:
DO recordings from instrument (blue dot) and DO of corresponding reference
samples determined by Winkler Titrations (red triangles.)
Bottom panel:
Time series of the difference
between the EXO2 and reference measurements for each matched pair. Cast 2 and 3 are plotted on the same
graph and separated by the axis break.