


 49 / 59

Ref. No. [UMCES] CBL 2016-015
ACT VS16-06
49
Figure 12
. Temperature and DO concentration profiles for Muskegon Lake. Values were obtained from
the average of multiple instruments sampling at 1s frequency. The hypolimnion was approximately 8m
thick and contained depressed DO levels of less than 3 mg/L.
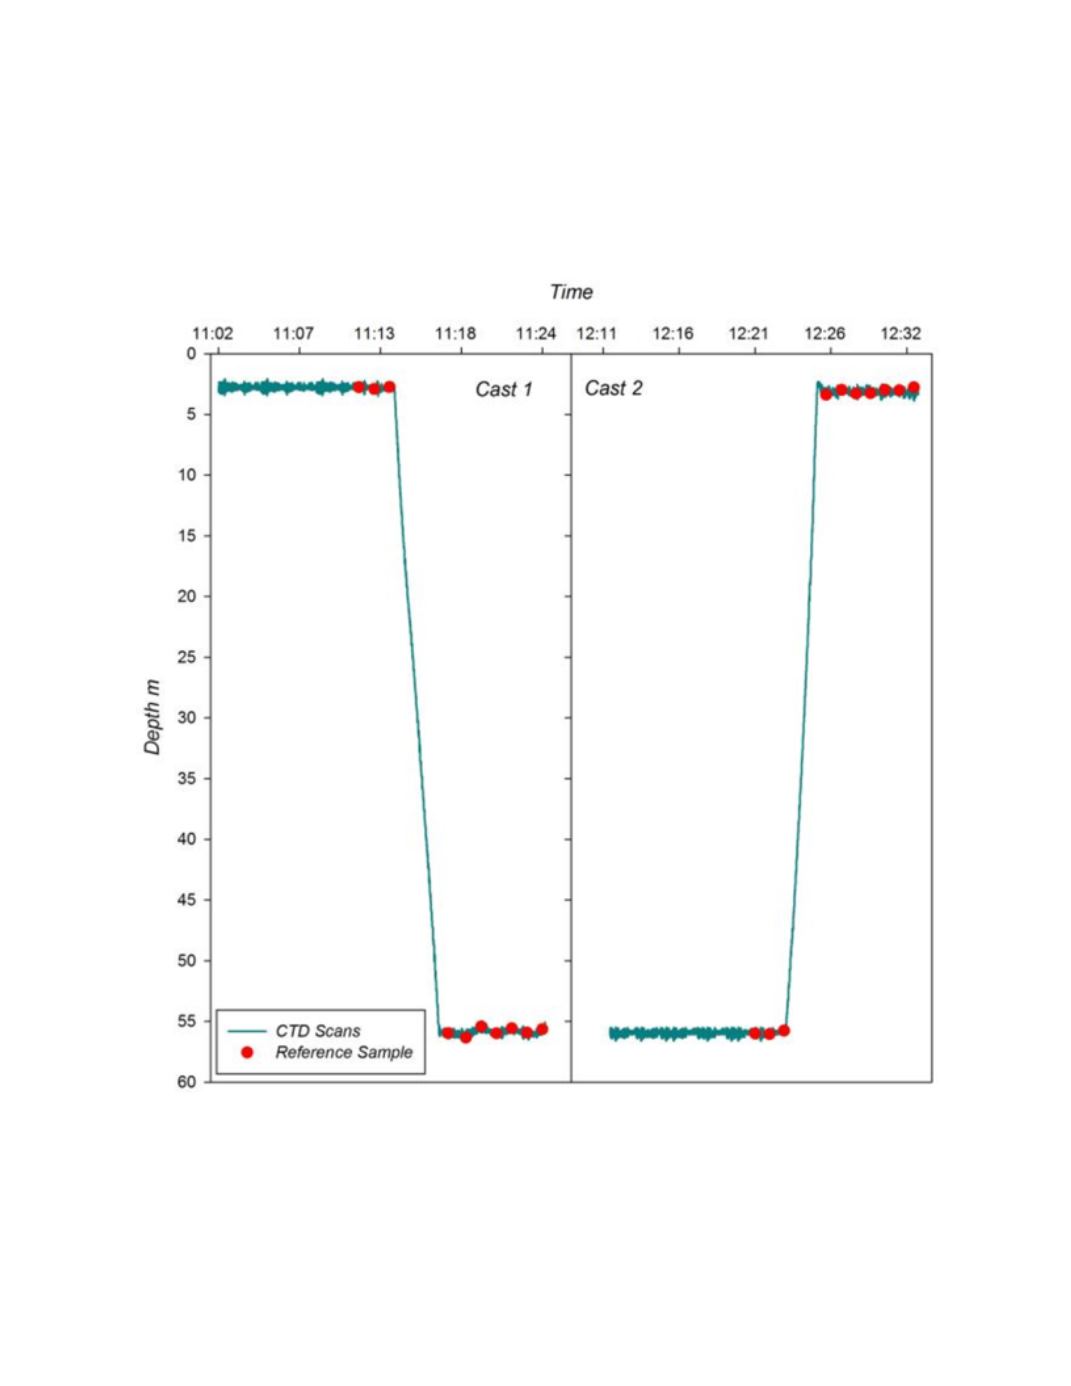
Figure 13
. Time series of the rosette profiling and Niskin bottle sampling for the two profiling trials in Lake
Michigan.