


 33 / 73

Ref. No. [UMCES] CBL 2016-010
ACT VS16-01
33
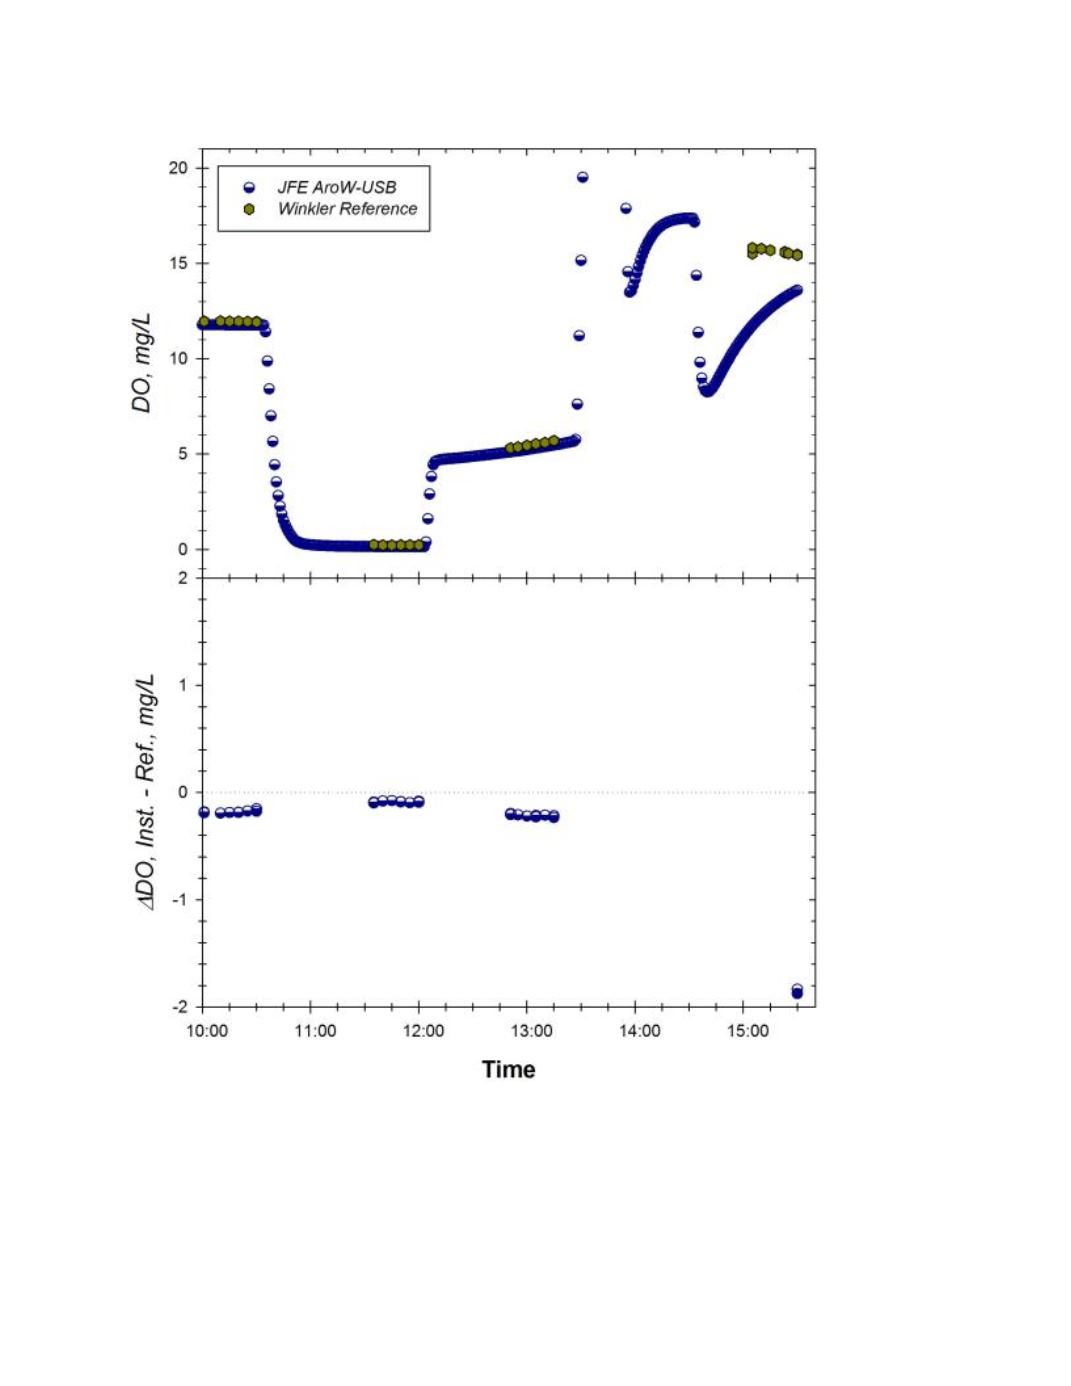
Figure Q
. Response of JFE AroW-USB (sn 0181) to changing dissolved oxygen concentrations at 5.3
o
C and S=8.98.
Top
Panel
: Time series of instrument readings and Winkler reference samples drawn at level of sensor foil in well-mixed test
tanks. The decay in instrument signal under high DO exposure likely reflects bubble contamination of DO sensor foil.
Bottom Panel
: Corresponding offset between instrument reading and Winkler DO reference sample during the trial.
Dotted line represents zero offset from reference.