


 28 / 73

Ref. No. [UMCES] CBL 2016-010
ACT VS16-01
28
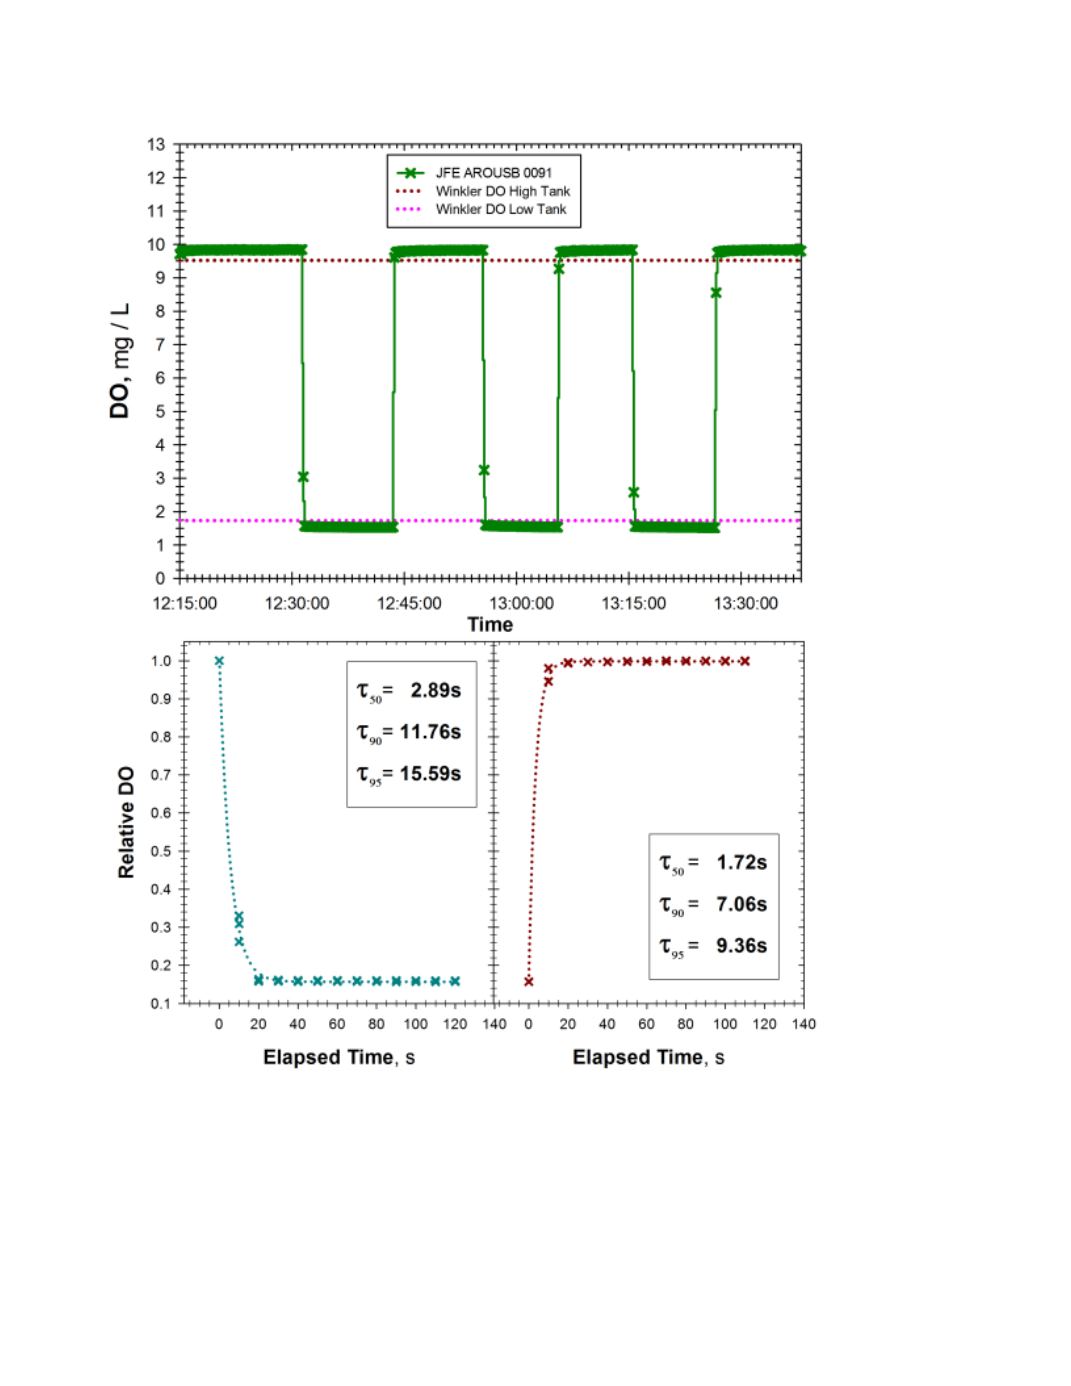
Figure L.
Functional sensor response time assessment of the JFE AROUSB (sn 0091).
Top Panel
: Time series of 10s
instrument reads during transfers between adjacent high and low DO water baths, maintained commonly at 15
o
C.
Indicated DO levels were maintained by air stone bubblers (high DO) or air+N2 (low DO) and verified by Winkler
assays.
Bottom Panels
: All high DO to low DO transitions were normalized to last reading before condition switch for
the indicated post transition time. Data was fit with a 3 parameter exponential decay function: DO
rel
= DO
relMin
+ a
e
-bt
and indicated τ calculated from fit. Data for low DO to high DO transitions (
lower right
) were treated similarly but
normalized to steady state value in subsequent high DO tank and subsequently fit with an analogous 3 parameter
exponential rise function: DO
rel
= DO
relMin
+ a(1-
e
-bt
) with indicated τ being directly calculated from fit.