


 19 / 59

Ref. No. [UMCES] CBL 2015-008
ACT VS15-01
19
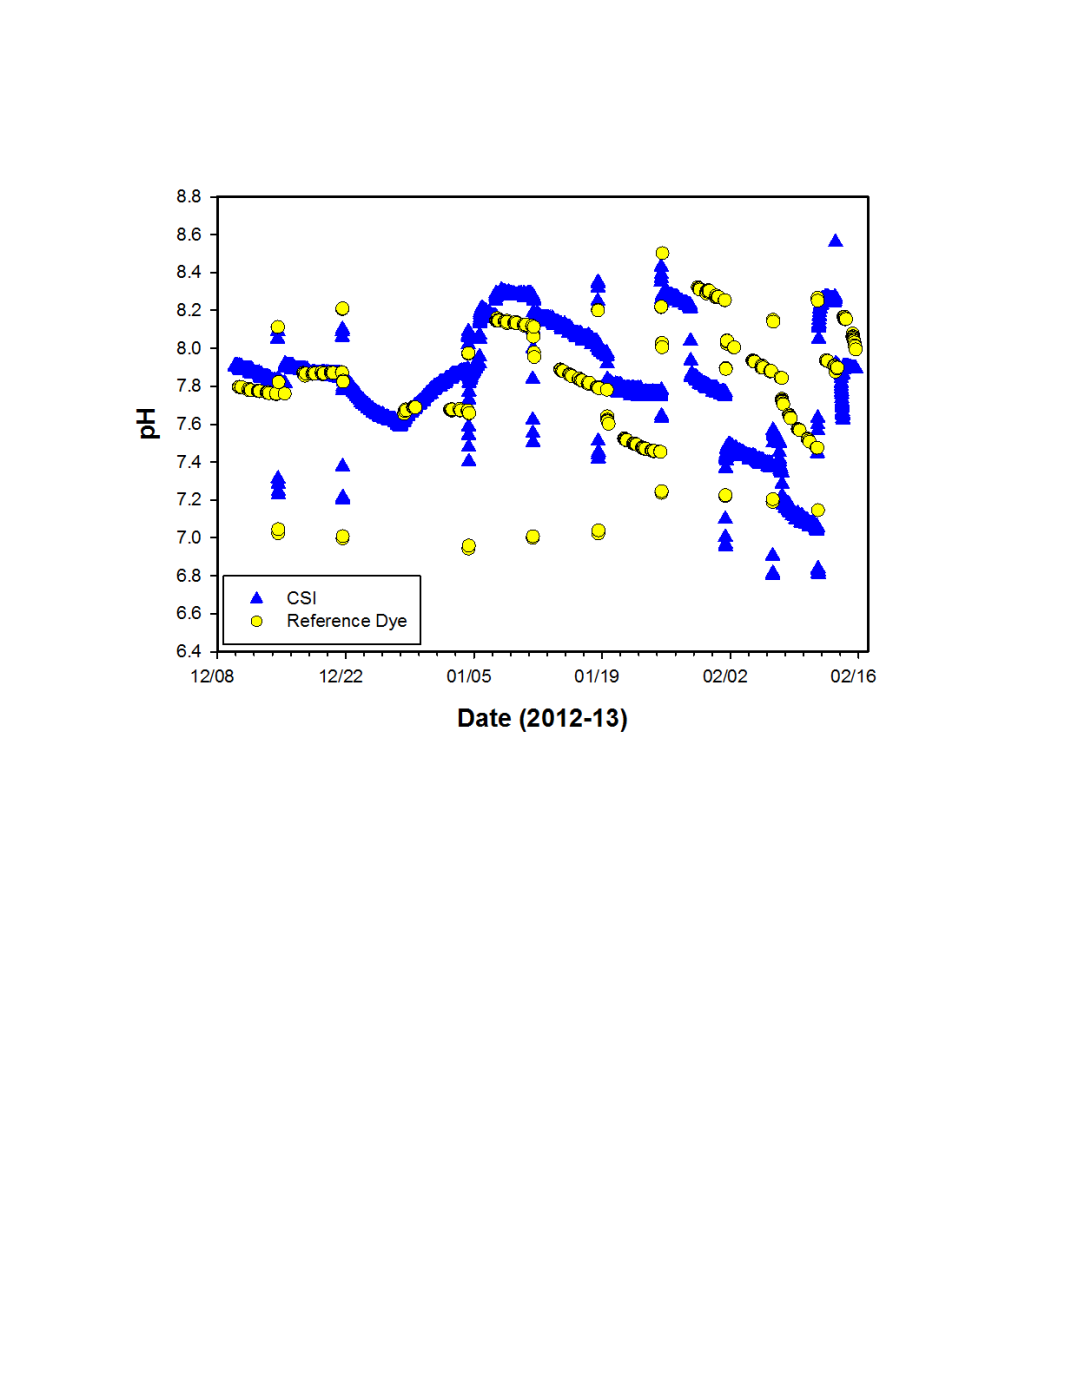
Figure 3.
Time series of the Campbell Scientific Instruments pH test instrument pH results along with
the dye reference pH results for the complete ten week lab test. Results include nine rapid pH transition
tests conducted at each temperature and salinity condition. Detailed plots of each transition test are
provided in Appendix I.
Results were further examined for the stable portions of the test for each of the source
waters and these data do not include any of the pH shifts or temperature shifts. For the saltwater
trials, salinity was maintained within 0.12 units (range = 35.14 to 35.26) with an average of
35.19 and temperature was maintained to within 0.8
o
C for each set point (Fig. 4 top). The first
temperature trial ranged from 20.07 to 20.88
o
C, with an average of 20.27
o
C, the second
temperature trial ranged from 9.98 to 10.64
o
C, with an average of 10.12
o
C, and the third
temperature trial ranged from 29.77 to 30.53
o
C, with an average of 29.90
o
C. Time series results
of the CSI, Metrohm data and reference pH data are shown in middle panel and the time series of
the calculated difference between CSI and reference pH are shown in the bottom panel. The
average difference between the CSI and reference pH for the stable seawater component was
0.063 ± 0.075, with a total range of -0.037 to 0.210 (N=59).
During the brackish water trials, salinity was maintained to within 0.11 units (range =
21.75 to 21.86) with an average of 21.80 and temperature was maintained to within 0.7
o
C for
each set point (Fig. 5 top). The first temperature trial ranged from 9.95 to 10.67
o
C, with an
average of 10.09
o
C, the second temperature trial ranged from 20.02 to 20.40
o
C, with an average