


 16 / 59

Ref. No. [UMCES] CBL 2015-008
ACT VS15-01
16
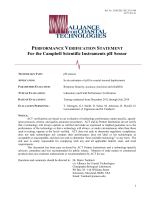
Test-tank water was circulating into the laboratory through a bypass tube for reference
sample withdrawal. The sequencing of temperature and salinity test conditions is shown in Fig.
1. Each given temperature and salinity condition was maintained at stable conditions for a week.
For saltwater trials, salinity averaged 35.19 ±0.03, and temperatures were varied
sequentially over the following three ranges 20.3 ±0.2, 10.1 ±0.1, and 29.9 ±0.1
o
C. For brackish
water trials, salinity averaged 21.80 ±0.03, and temperatures were varied sequentially over the
following three ranges 10.1 ±0.1, 20.2 ±0.1, and 30.4 ±0.1
o
C. For freshwater trials, salinity
averaged 0.26 ±0.05 and temperatures were varied sequentially over the following three ranges
10.1 ±0.1, 20.2 ±0.1, and 30.4 ±0.1
o
C. At the end of the nine week-long trials, a new batch of
seawater was introduced and temperatures were varied between 30 and 10
o
C over the course of
two days.
Figure 1.
Temperature (Teal) and salinity (Red) conditions maintained throughout the ten week long
laboratory test. Sensors were tested at three temperatures (10, 20, 30
o
C) at each of three salinities (0.3,
22, 35). Full seawater salinity conditions were briefly re-established at the end of the test and cycled
through the same temperature range to fill in missing instrument coverage.
As defined in the test protocols, two Metrohm electrodes were maintained within the test
tank throughout the lab study to provide a continuous, independent measure of pH at 15 minute
intervals. These results were not intended to be used as reference values for direct instrument