


 24 / 59

Ref. No. [UMCES] CBL 2015-008
ACT VS15-01
24
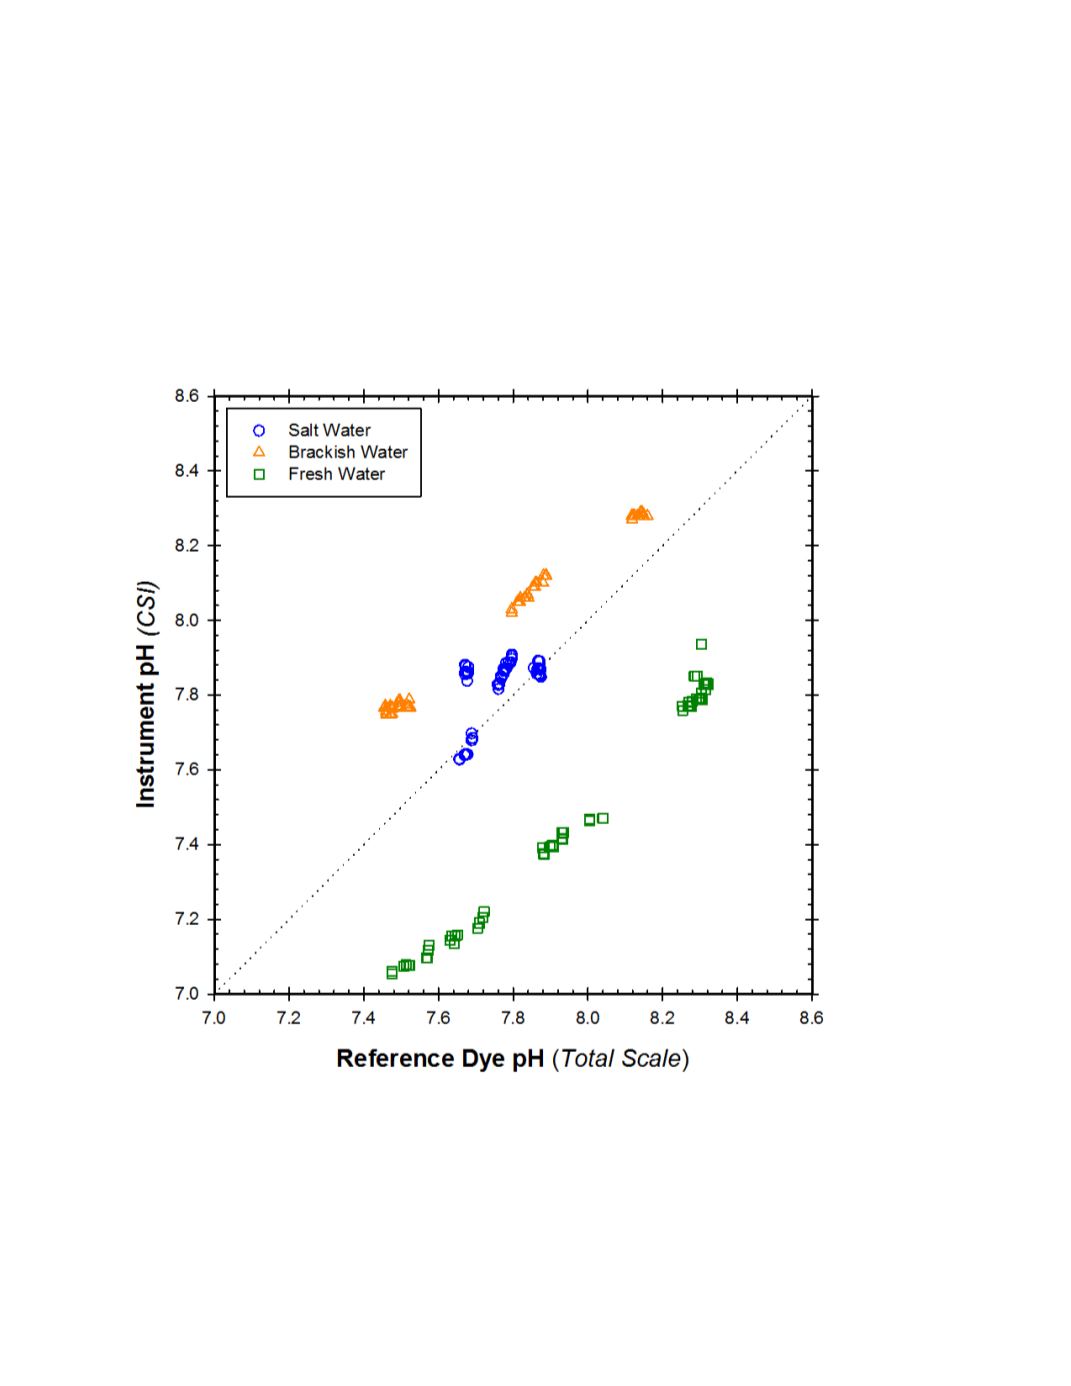
A cross plot of all corresponding CSI versus reference pH results is shown in figure 7.
The instrument performance was variable among water types with slopes and regression
coefficients ranging from 0.53 (r
2
=.29), 0.80 (r
2
= .99), and 0.97 (r
2
=0.99) for seawater, brackish
water, and freshwater tests respectively. The overall linear regression through all of the data had
a slope of 0.49 with an intercept of 3.97 (r
2
= 0.16). The mean and standard deviation of the
calculated difference between the CSI measurement and the reference pH for all matched pairs
within the three stable testing periods was -0.048 ±0.313 (N=197).
Figure 7.
Cross plot of Campbell Scientific Instruments (CSI) pH sensor measurements against the dye
reference pH measurements for 201 matched observations during the stable Temperature and Salinity
portions of the entire lab test.