


 26 / 59

Ref. No. [UMCES] CBL 2015-008
ACT VS15-01
26
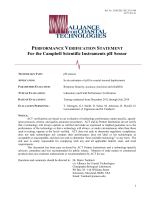
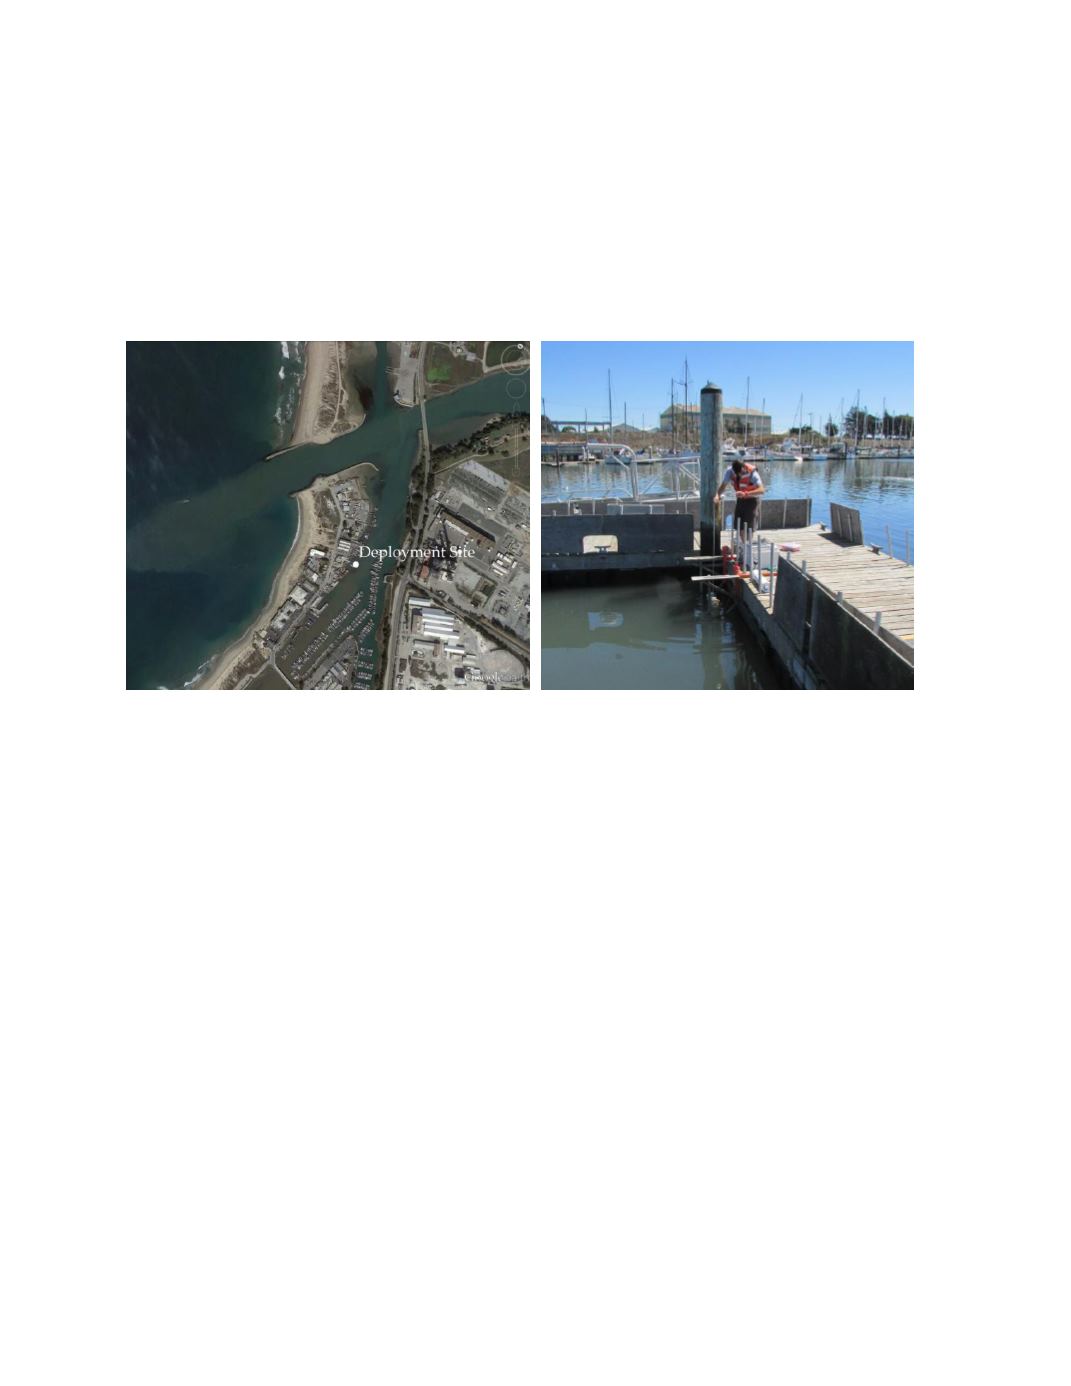
Moss Landing Marine Laboratories Field Deployment Site
A month-long moored field test was conducted at the Moss Landing Marine Laboratories
from August 26 to September 22, 2013. The deployment site was located at 36.80°N, 121.79°W,
in the Small Boat Facilities area of Moss Landing Harbor (Photo 2). This secure deployment site
was located in the Harbor on the junction of the northern tributary of the Salinas River and
Elkhorn Slough National Estuarine Reserve on the central coast of California. Instrumentation
was deployed off a floating dock in waters with a tidal range of 2 meters and a maximum depth
below the dock of 4 meters.
Photo 2.
Aerial view of MLML Harbor (left) and dockside mooring deployment (right).
Time series results of ambient conditions for tidal height, temperature, and salinity are
given in figure 8. Temperature ranged from 14.9 to 18.6 and salinity from 30.7 to 33.7 over the
duration of the field test. The bottom panel displays the maximum difference recorded between
all reference thermistors (RBR solo and SBE 26) mounted at the same depth at different
locations across the mooring rack. The average temperature difference observed across the space
of the mooring rack was 0.11
o
C with a maximum of 0.8
o
C. The difference between the test
instruments instantaneous temperature reading and the final reference temperature will contribute
to the variability and offset to the calculated ambient reference pH. It is not possible to quantify
the exact difference between the averaged reference temperature and that measured by the test
instrument, but a difference of 1
o
C would amount to an approximate offset of 0.015 pH units at
ambient conditions. Additional differences resulting from variation in the actual chemistry of the
water across this space may exist but will be minimized because the sampling bottle integrates
across the mooring space.
The CSI operated continuously over 28 days and generated 2579 observations at 15
minute intervals. Time series results of the CSI and corresponding reference pH results are given
in figure 9. Ambient pH measured by the CSI ranged from 7.759 to 7.960, compared to the
range captured by reference samples of 7.933 to 8.077. The bottom panel presents the time
series of the difference between instrument and reference pH measurements for each matched
pair (n=84 observations). The average and standard deviation of the measurement difference
over the total deployment was -0.152 ± 0.023 with a total range of -0.253 to -0.115.