


 31 / 47

Ref. No. [UMCES] CBL 2015-009
ACT VS15-02
31
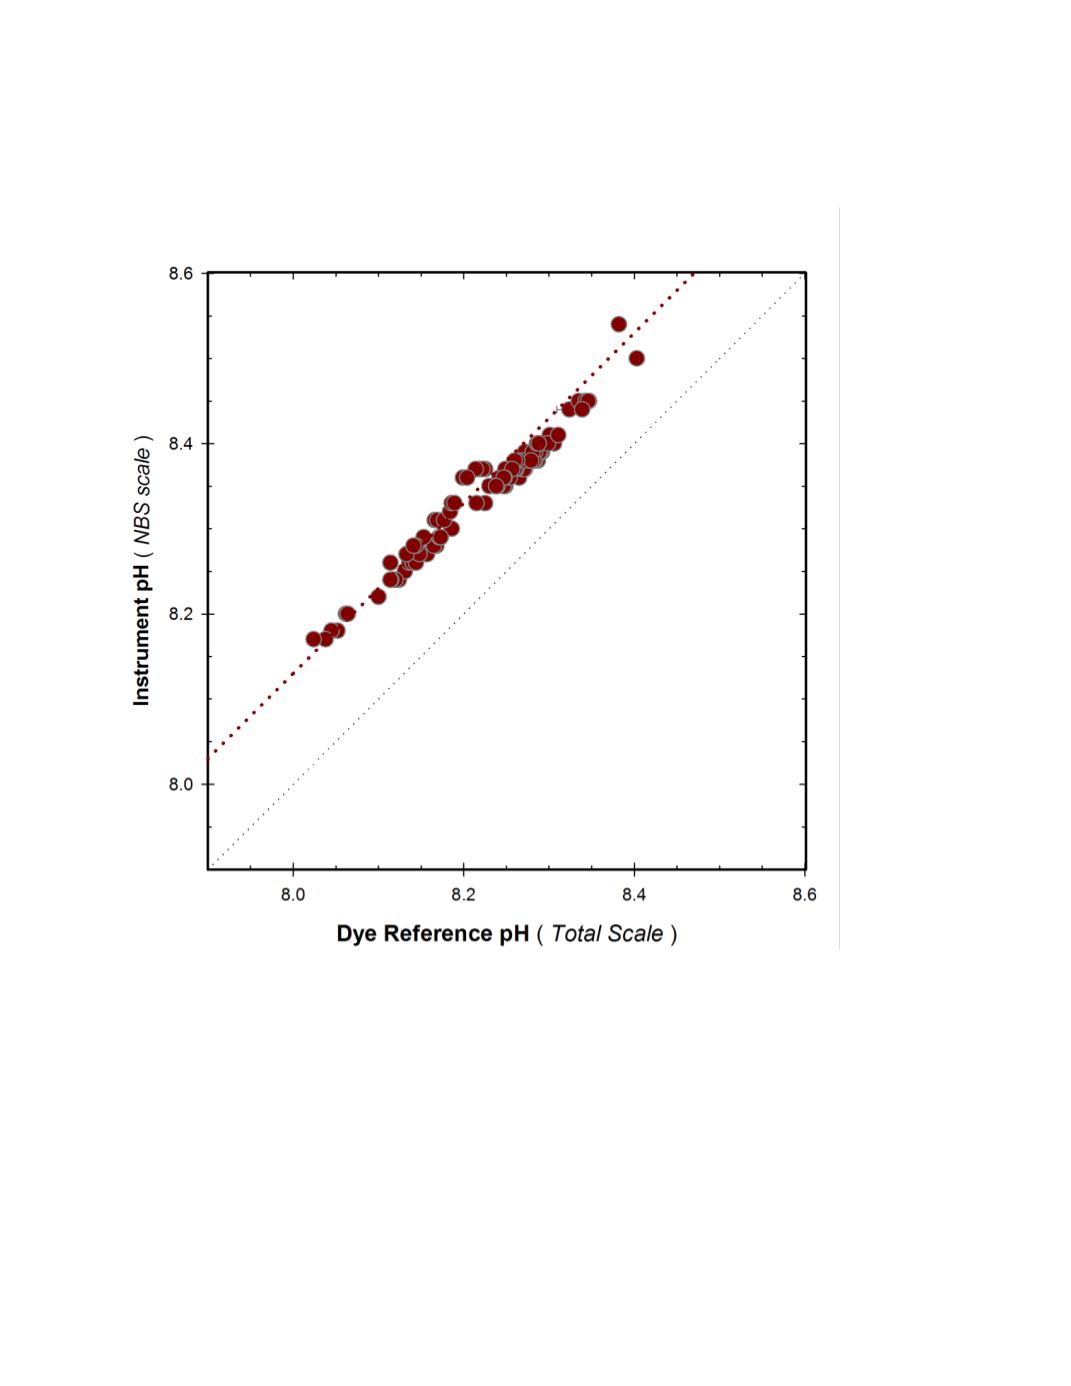
A cross-plot of the matched observations is given in figure 11. A linear regression of the
data was highly significant (p<0.001, R2 = 0.96) with a slope of 0.88 and intercept of 1.14.
Figure 11.
CBL field response plot of Manta2 pH sensor deployed with antifouling copper screen
compared to reference pH
Total
samples. Fine dotted line represents 1:1 correspondence, coarse dotted line
represents correspondence predicted based on difference between pH
NBS
and pH
Total
in seawater (pH
NBS
=
pH
Total
+ 0.13).