


 29 / 47

Ref. No. [UMCES] CBL 2015-009
ACT VS15-02
29
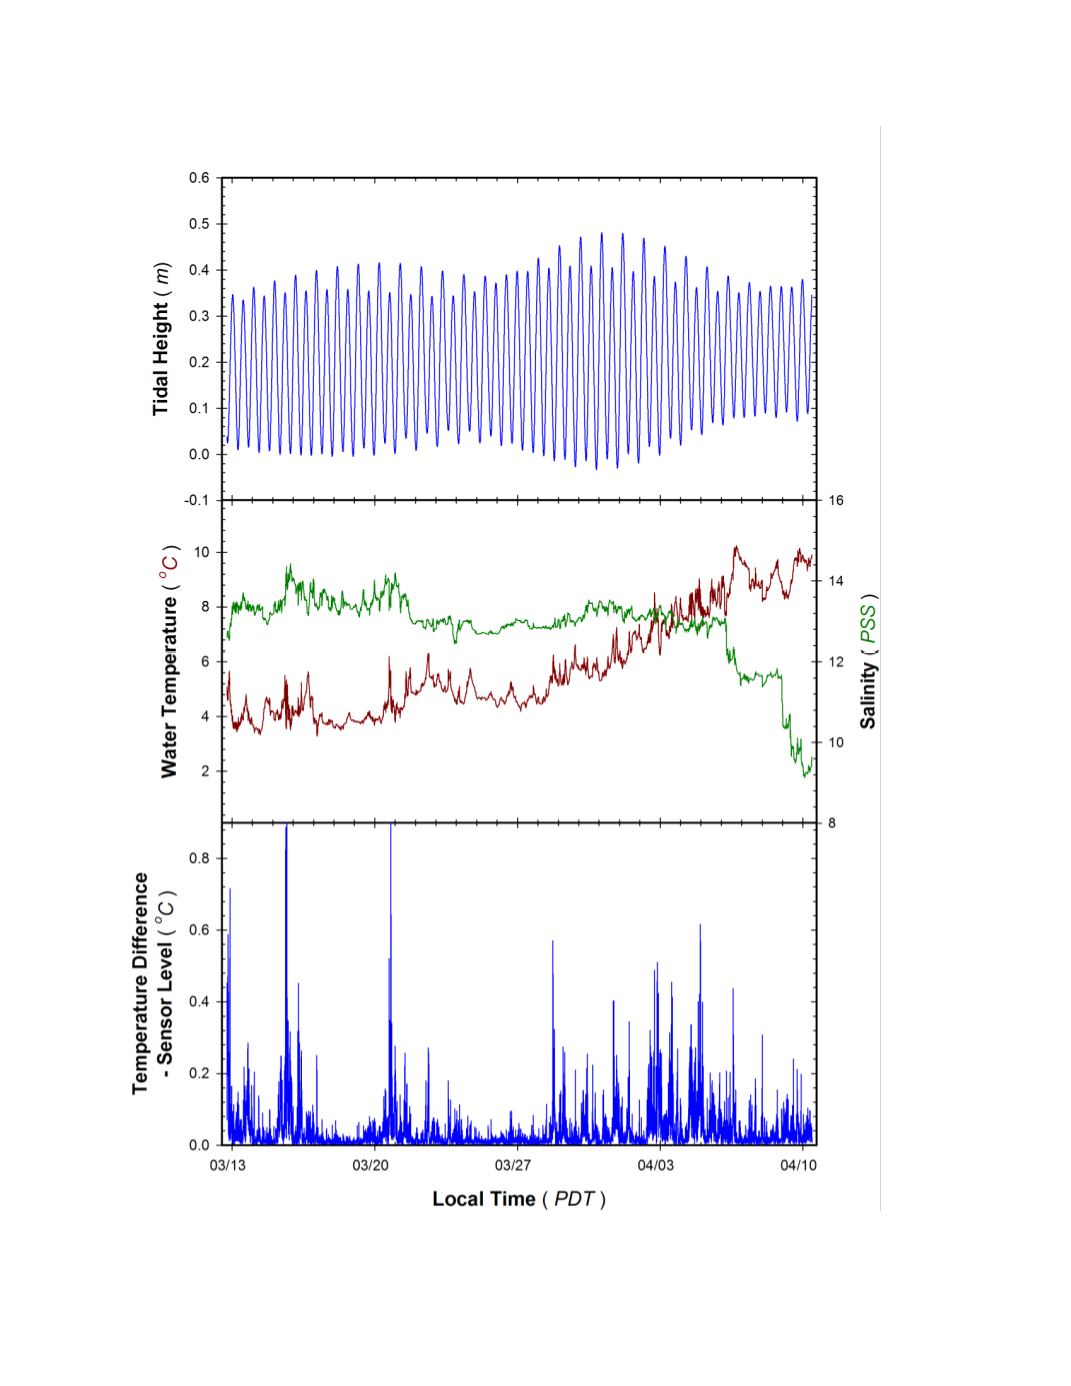
Figure 9.
Environmental conditions encountered during the 1 month CBL floating dock deployment. Test
sensor array deployed at 1 m fixed depth, variation in local tidal heights indicate active water flow around
instrument (
Top Panel
). Variation in salinity (green) and temperature (red) at depth of instrument sensor
detected by an SBE 26 and two RBR Solo thermistors (
Middle Panel
). Temperature range determined from
max-min temperatures detected by RBR and SBE thermistors spanning instrument sensor array (
Bottom Panel
).