


 30 / 47

Ref. No. [UMCES] CBL 2015-009
ACT VS15-02
30
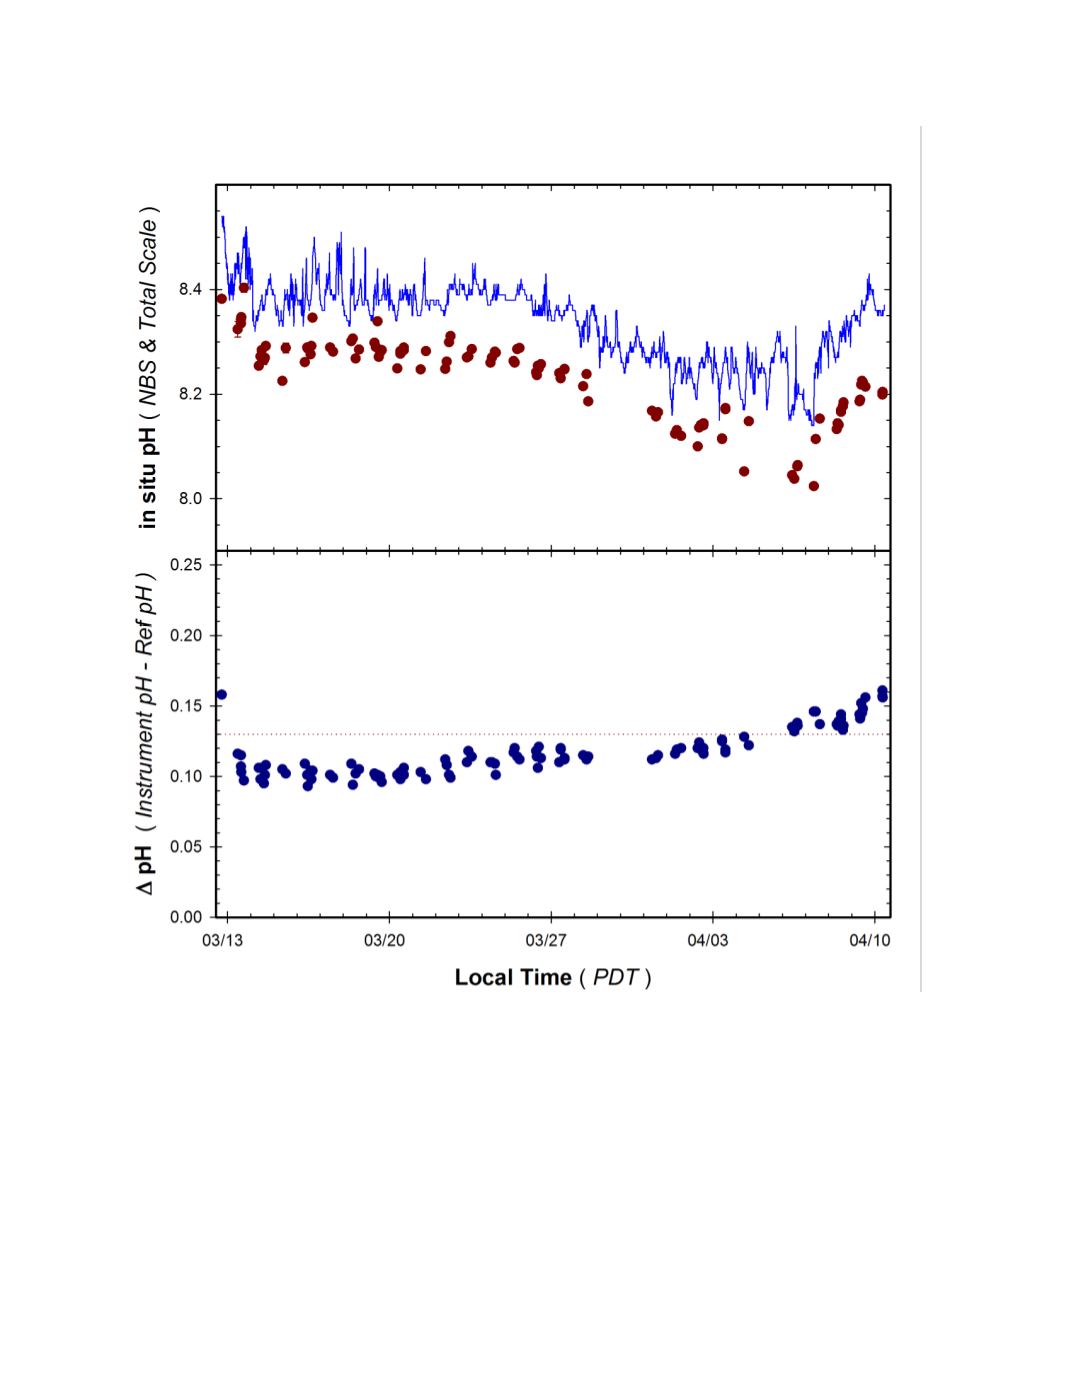
Figure 10.
Time series of pH measured by Manta2 sonde deployed with antifouling copper screen
during the 1 month CBL trial.
Top Panel
: Continuous pH
NBS
recordings from instrument (blue line) and
pH
Total
of adjacent grab samples determined by phenol red dye (red circles).
Bottom Panel
: Difference in
measured pH relative to reference samples (Instrument – Dye Ref) observed during deployment. Dashed
line represent offset (ca 0.13) predicted due to difference in pH
NBS
and pH
Total
scales used by the Manta2
sensor and the dye reference method.