


 36 / 47

Ref. No. [UMCES] CBL 2015-009
ACT VS15-02
36
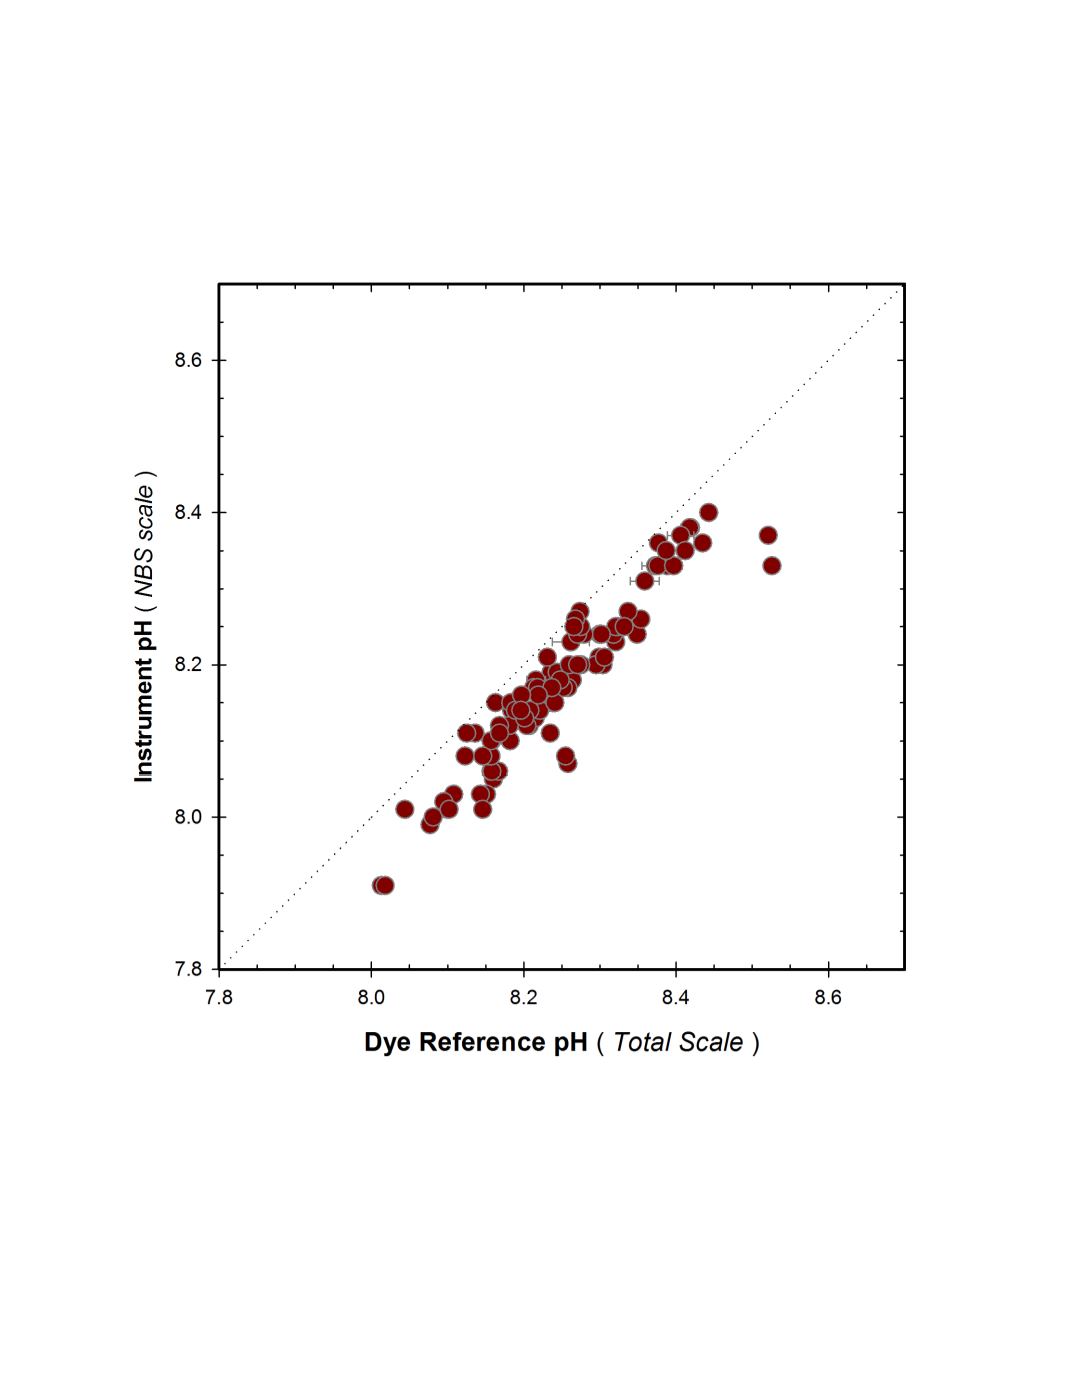
A cross-plot of the matched observations is given in figure 14. The linear regression was
highly significant (p<0.001, R
2
= 0.89) with a slope of 0.99 and intercept of -0.03.
Figure 14.
GLERL field response plot of Manta2 pH sensor deployed with antifouling copper screen
compared to reference pH
Total
samples. Fine dotted line represents 1:1 correspondence, expected
agreement between pH
NBS
and pH
Total
in freshwater.