


 39 / 47

Ref. No. [UMCES] CBL 2015-009
ACT VS15-02
39
QUALITY ASSURANCE AND QUALITY CONTROL
A variety of procedures were established for this verification to ensure the highest quality
of data possible. Foremost was the development of detailed, scientifically reviewed testing
protocols and state of the art analytical methodologies. Each reference sample generated was
analyzed in triplicate and any result with a standard deviation of greater than 0.01 pH units was
initially flagged. If there was an obvious reason to exclude any of the triplicates due to handling
errors, that triplicate was eliminated and a new value computed from the remaining two
replicates. Reference values with a standard deviation of greater than 0.02 were discarded.
External standards were run weekly to verify consistency in performance of the
spectrophotometric dye analysis.
Quality Control Samples
Each site also conducted weekly field duplicates and one field trip blank, with the
exception that no filed trip blank was conducted in Hawaii and only one field duplicate was
conducted during the Moss Landing moored deployment. Results of these QA/QC samples are
presented below in Tables 3 – 6. The global average of the standard deviation among field
duplicates for all field test sites was 0.005 ±0.008 (n=21), with two values exceeding our
expected quality threshold of better than 0.01 pH units. These results attest to the
representativeness of our sampling to water mass being analyzed by the test instruments and to
consistent sample handling. The three field trip blanks that were performed had a standard
deviation among the paired samples of 0.003, 0.002, and 0.002. The absolute difference between
the paired samples was 0.004, 0.003, and 0.003. The field trip blanks attest to proper cleaning
and handling of sampling equipment and sample processing.
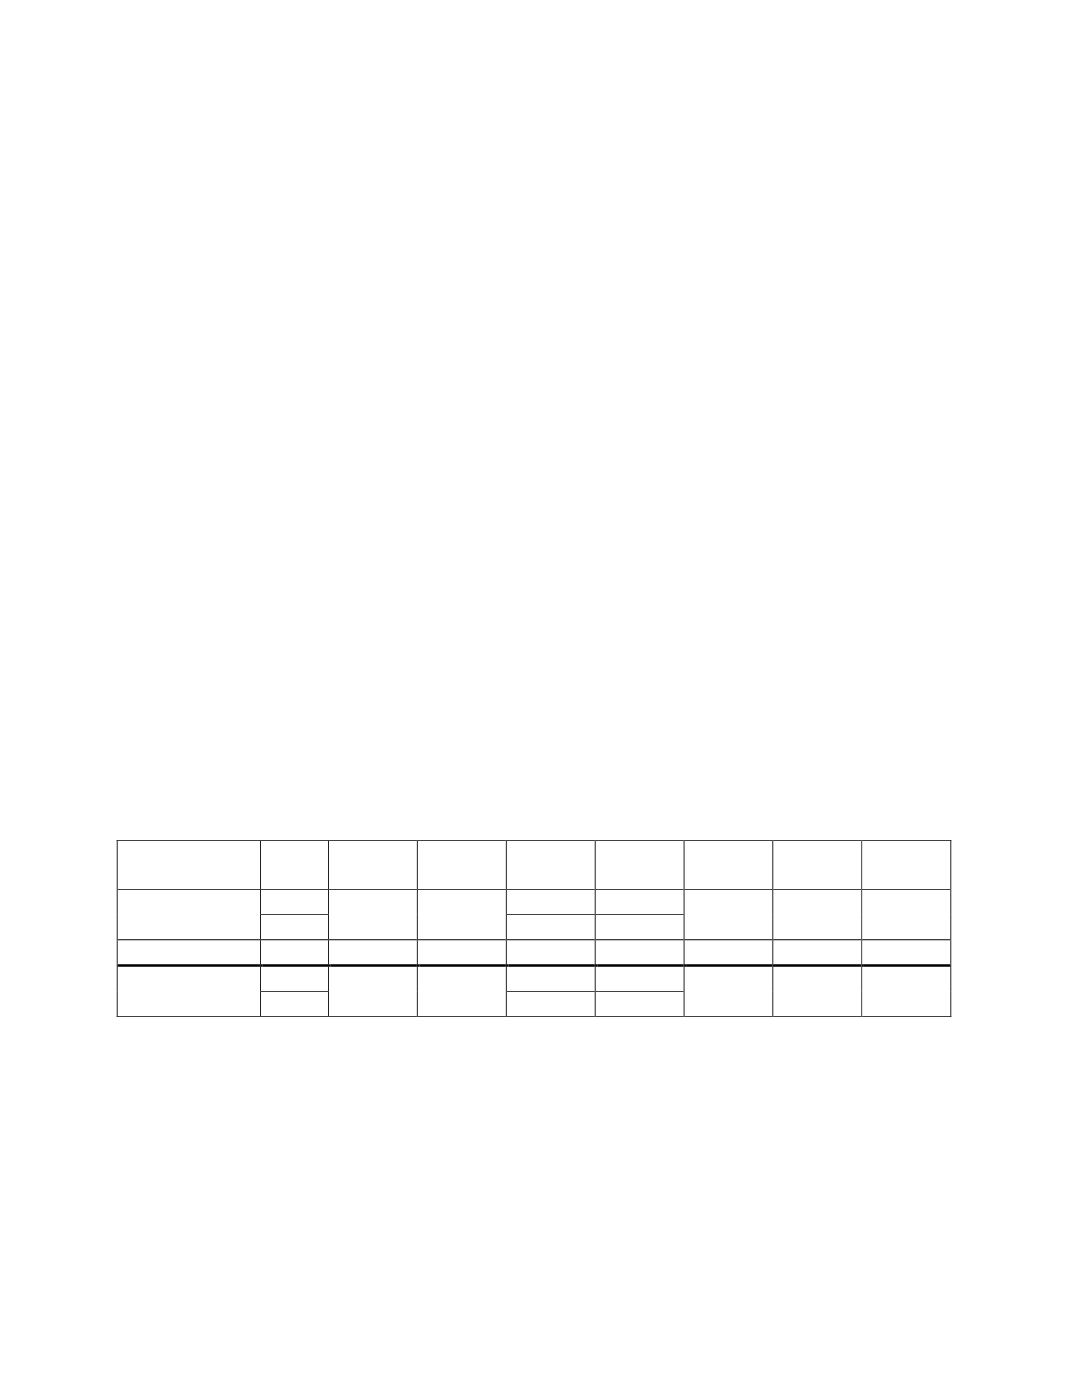
Table 3.
Results of Field Duplicates (FD) and Field Trip Blank (FTB) for the Moss Landing Harbor, CA
mooring test. The field trip blank was determined with a Seawater CRM from the Dickson Lab at Scripps
Institute of Oceanography.
Date/Time
Rep
Temp
Salinity
pH
Std Dev Mean Std Dev
ABS
Diff
9-10-13 14:00
FD1
15.0
33.0
8.059
.003
8.049
.015
.021
FD2
8.038
.001
9-5-13 11:20
FTB1
22.0
35.0
7.974
.001
7.972
.003
.004
FTB2
7.970
.001