


 38 / 47

Ref. No. [UMCES] CBL 2015-009
ACT VS15-02
38
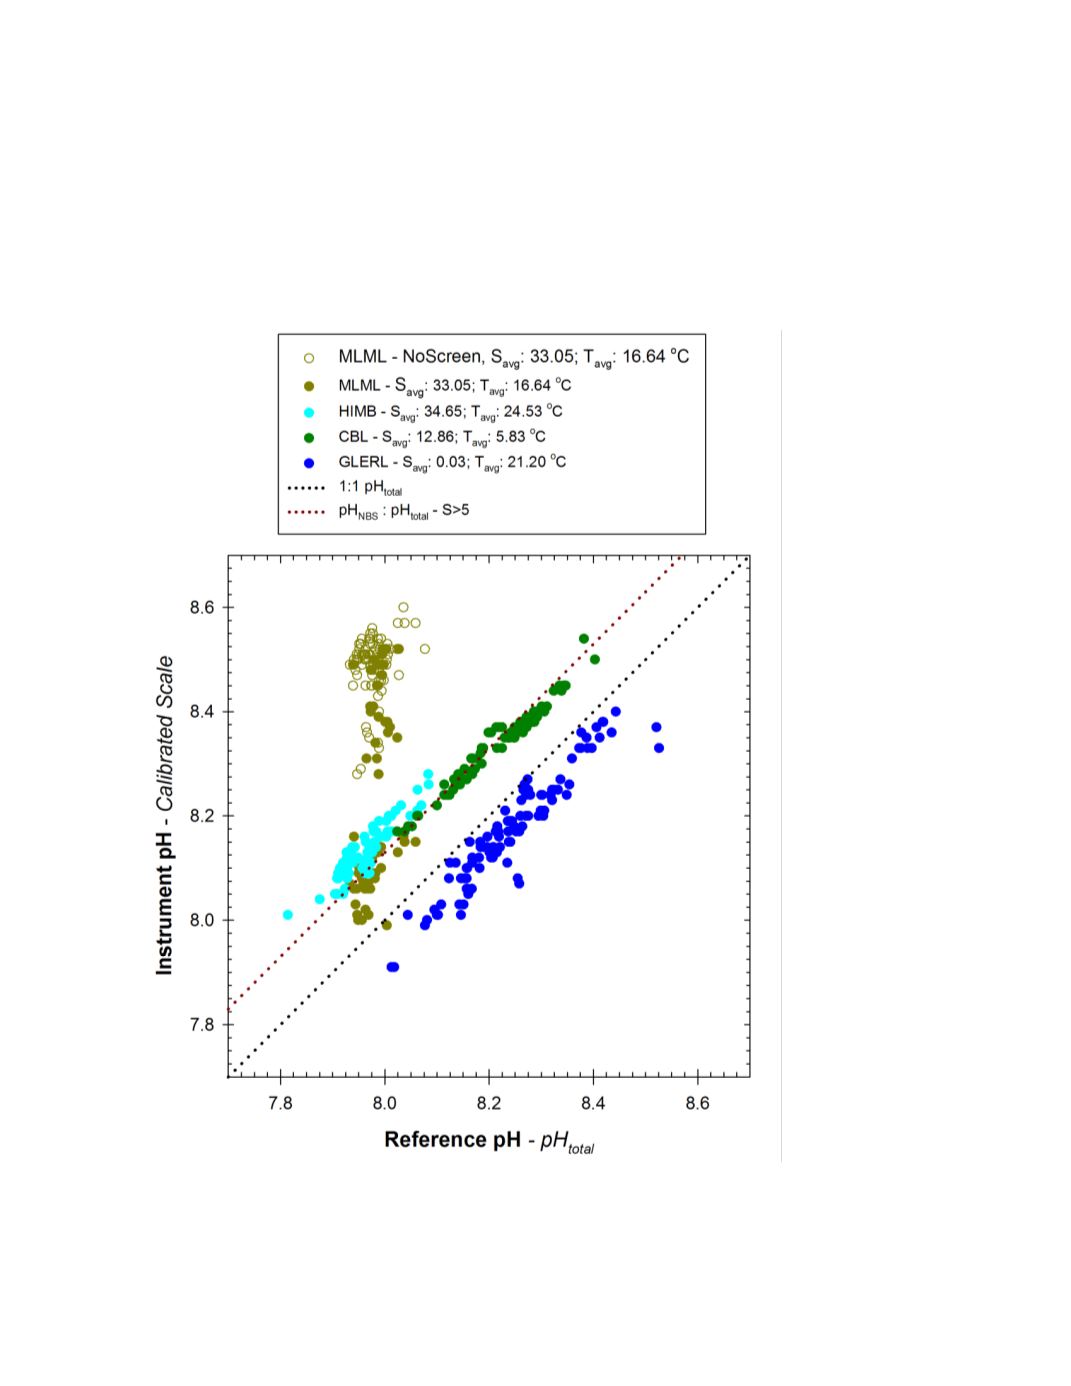
A summary plot of the Manta2 versus dye reference pH for all sites is shown in figure 15.
The Manta2 responded consistently with good agreement to reference pH measurements at three
of the four test sites. No explanation or observed failure was discovered to explain the
performance at the Moss Landing test site. Results for the brackish and saline test sites show the
expected offset due to calibration and scale differences. The low ionic freshwater test and
phenol red based dye measurement shows a closer agreement to a direct 1:1 relationship.
Figure 15.
Global response plot for Manta2 pH sensors observed during ACT field trials. Black dotted
line represents 1:1 correspondence, red dotted line represents correspondence predicted based on
difference between pH
NBS
and pH
Total
in seawater (pH
NBS
= pH
Total
+ 0.13).