


 28 / 47

Ref. No. [UMCES] CBL 2015-009
ACT VS15-02
28
Moored Deployment at Chesapeake Biological Laboratory (CBL)
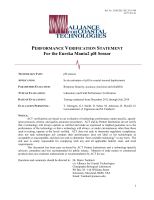
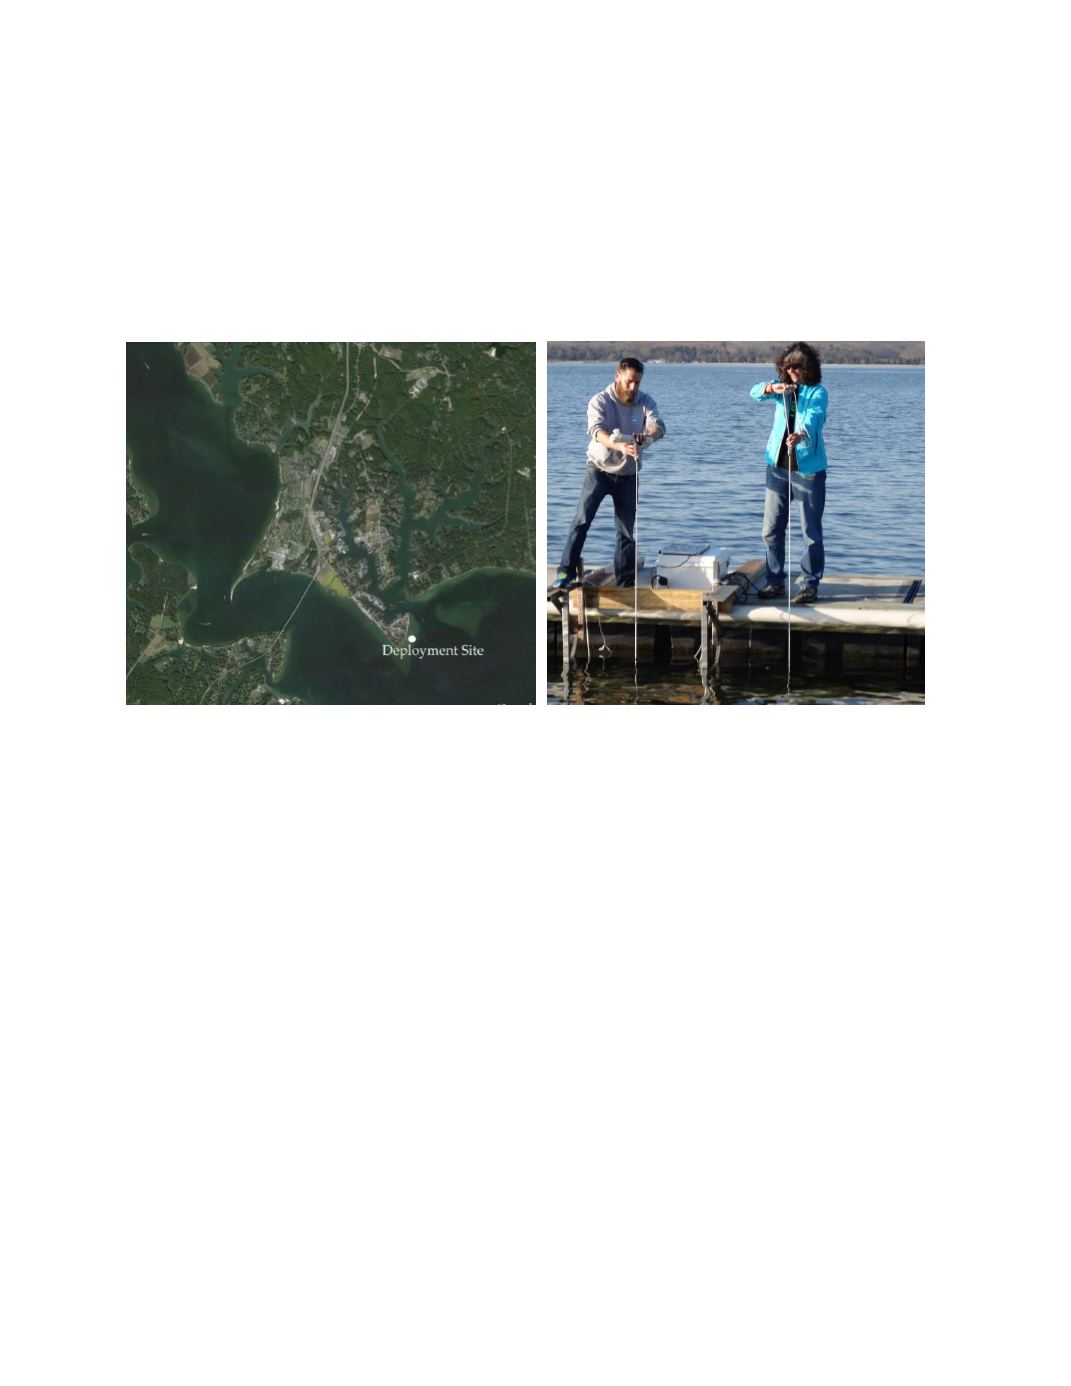
A month-long moored field test was conducted in Chesapeake Bay from March 3 to April
10, 2014. The deployment was located at 38.32°N, 76.45°W attached to the end of a pier at the
mouth of the Patuxent River (Photo 5.) The average water depth of the test site was 2.2 m. The
site was brackish with salinity ranging from 9.1 PSU to 14.3 PSU during the deployment and
temperature ranging from 3.3 °C to 10.2 °C.
Photo 5.
Aerial view of CBL deployment site (left) and duplicate sampling at mooring rack.
Time series results of ambient conditions for tidal height, temperature, and salinity are
given in figure 9. Temperature ranged from 3.4 to 10.1 and salinity from 9.3 to 14.0 over the
duration of the field test. The bottom panel displays the maximum difference recorded between
all reference thermistors (RBR Solo and SBE26) mounted at the same depth and different
locations across the mooring rack. The average temperature difference observed across the space
of the mooring rack was 0.04 ±0.06
o
C, with a maximum of 1.38
o
C. As noted above, it is not
possible to quantify the exact difference between the averaged reference temperature and that
measured by the test instrument, but differences resulting from this variation and variation in the
chemistry of the water across will be minimized by the sampler integrating across the mooring
space.
The Manta2 operated successfully over the entire deployment from March 12 through
April 10 and generated 2756 observations based on its 15 minute sampling interval. Time series
results of the Manta2 and corresponding reference pH results are given in figure 10. Ambient
pH measured by the Manta ranged from 8.14 to 8.54, compared to the range captured by the
reference measurements of 8.024 to 8.403. The bottom panel presents the time series of the
difference between the Manta2 and reference pH for each matched pair (n=107 observations).
The average and standard deviation of the measurement difference was 0.12 ±0.02, with the total
range of differences from 0.09 to 0.16.