


 36 / 53

Ref. No. [UMCES] CBL 2016-012
ACT VS16-03
36
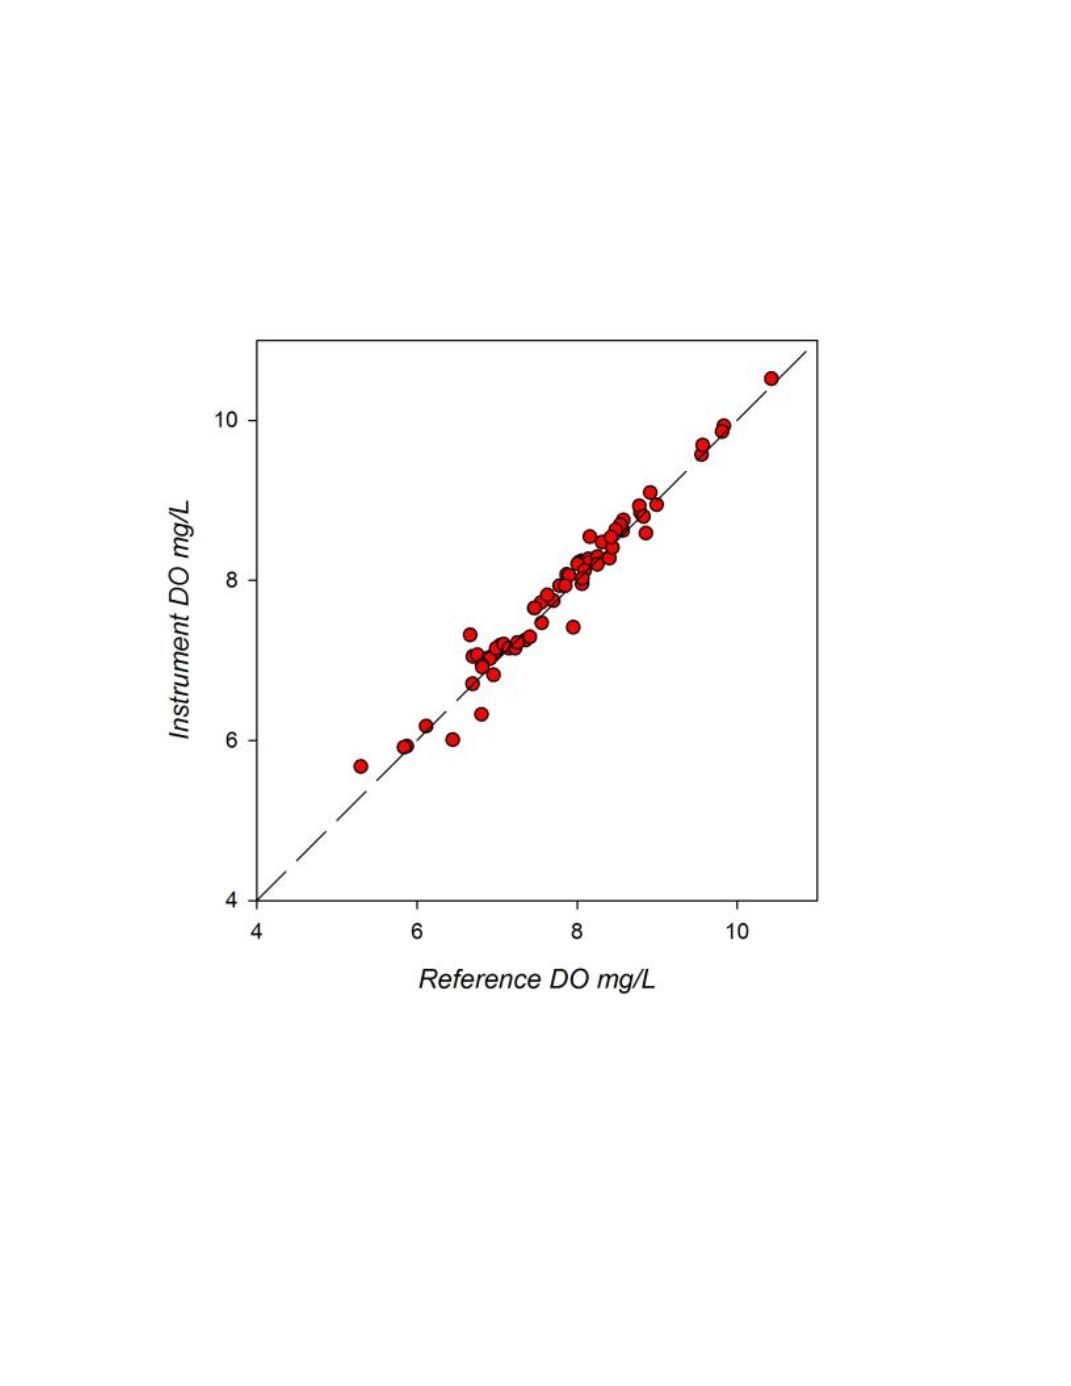
A cross-plot of all matched observations for the first month of the deployment is given in
figure 6. Comparisons were limited to one month as a representation of a typical field deployment
and to focus on initial instrument offset versus impacts of biofouling during an extended
deployment. A linear regression of the data (r
2
= 0.97; p<0.001) produced a slope of 0.985 and
intercept of 0.181.
Figure 6.
CBL field response plot for SBS HydroCAT compared to reference DO samples. The plotted line
represents a 1:1 correspondence.