


 40 / 53

Ref. No. [UMCES] CBL 2016-012
ACT VS16-03
40
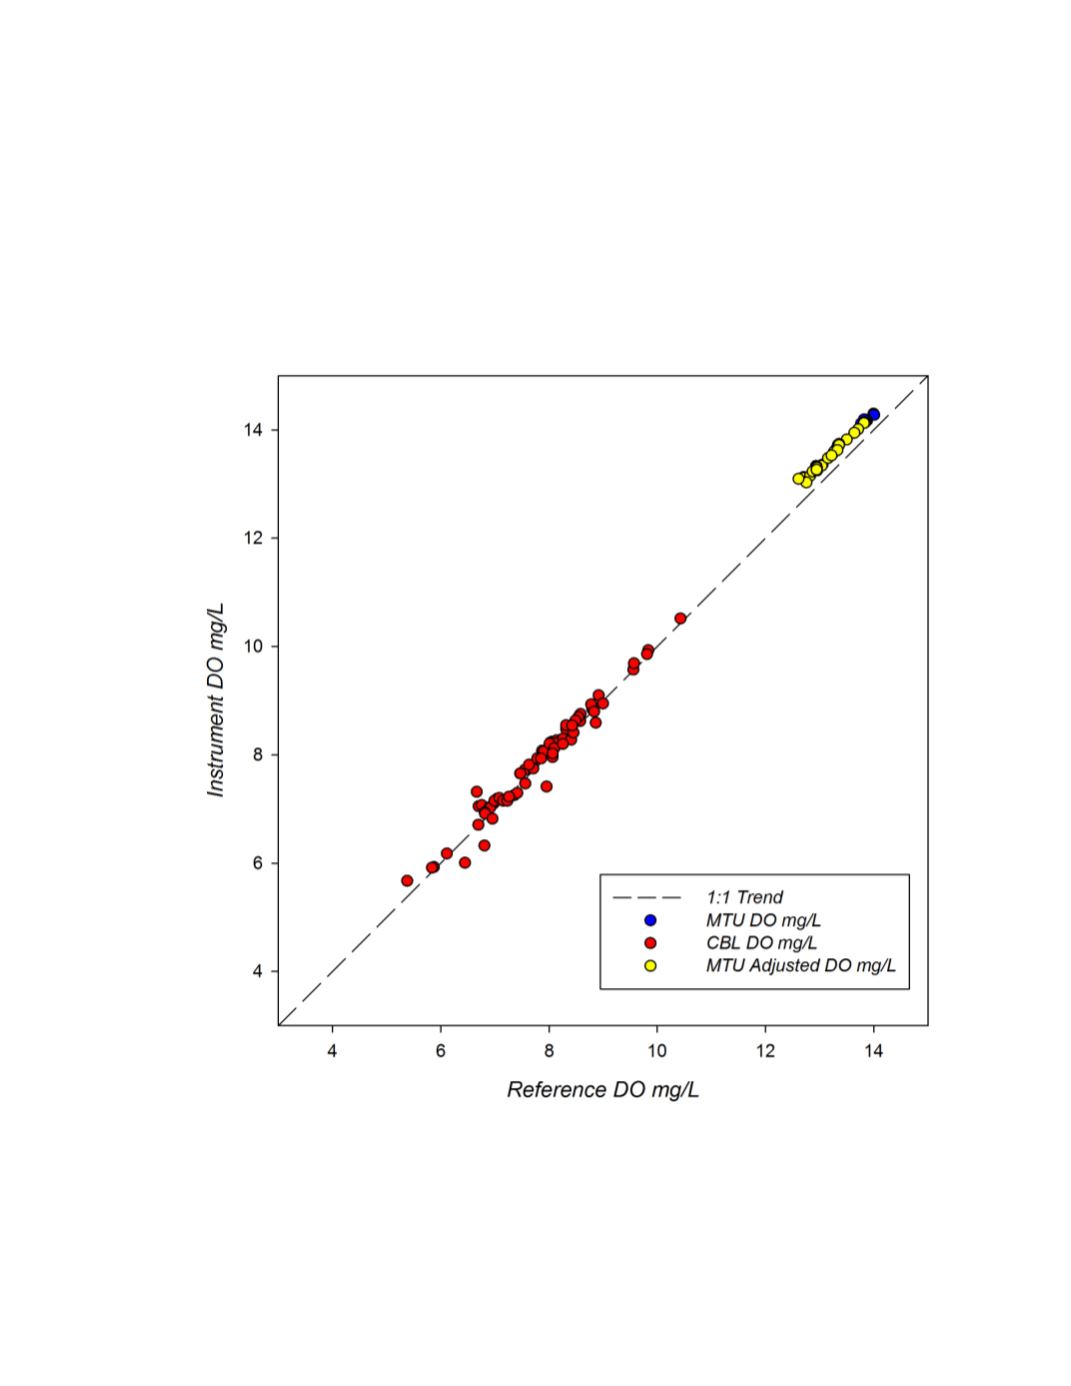
A global summary of instrument versus reference readings for all two field deployment
sites are plotted in figure 10. The SBS HydroCAT response showed good linearity over the two
salinity ranges tested which included freshwater, and brackish water. The response curves were
generally consistent across the concentration range within a given test site and over the broader
range of DO conditions (4 - 14 mg/L) across sites, with the noted result of a likely initial
calibration offset for the freshwater test. A linear regression of the composited data (r
2
= 0.997;
p<0.0001)) had a slope of 1.043 and intercept of -0.261.
Figure 10.
Global response plot for the SBS HydroCAT instruments observed during the three ACT field
trials. Black dotted line represents a 1:1 correspondence.