


 31 / 53

Ref. No. [UMCES] CBL 2016-012
ACT VS16-03
31
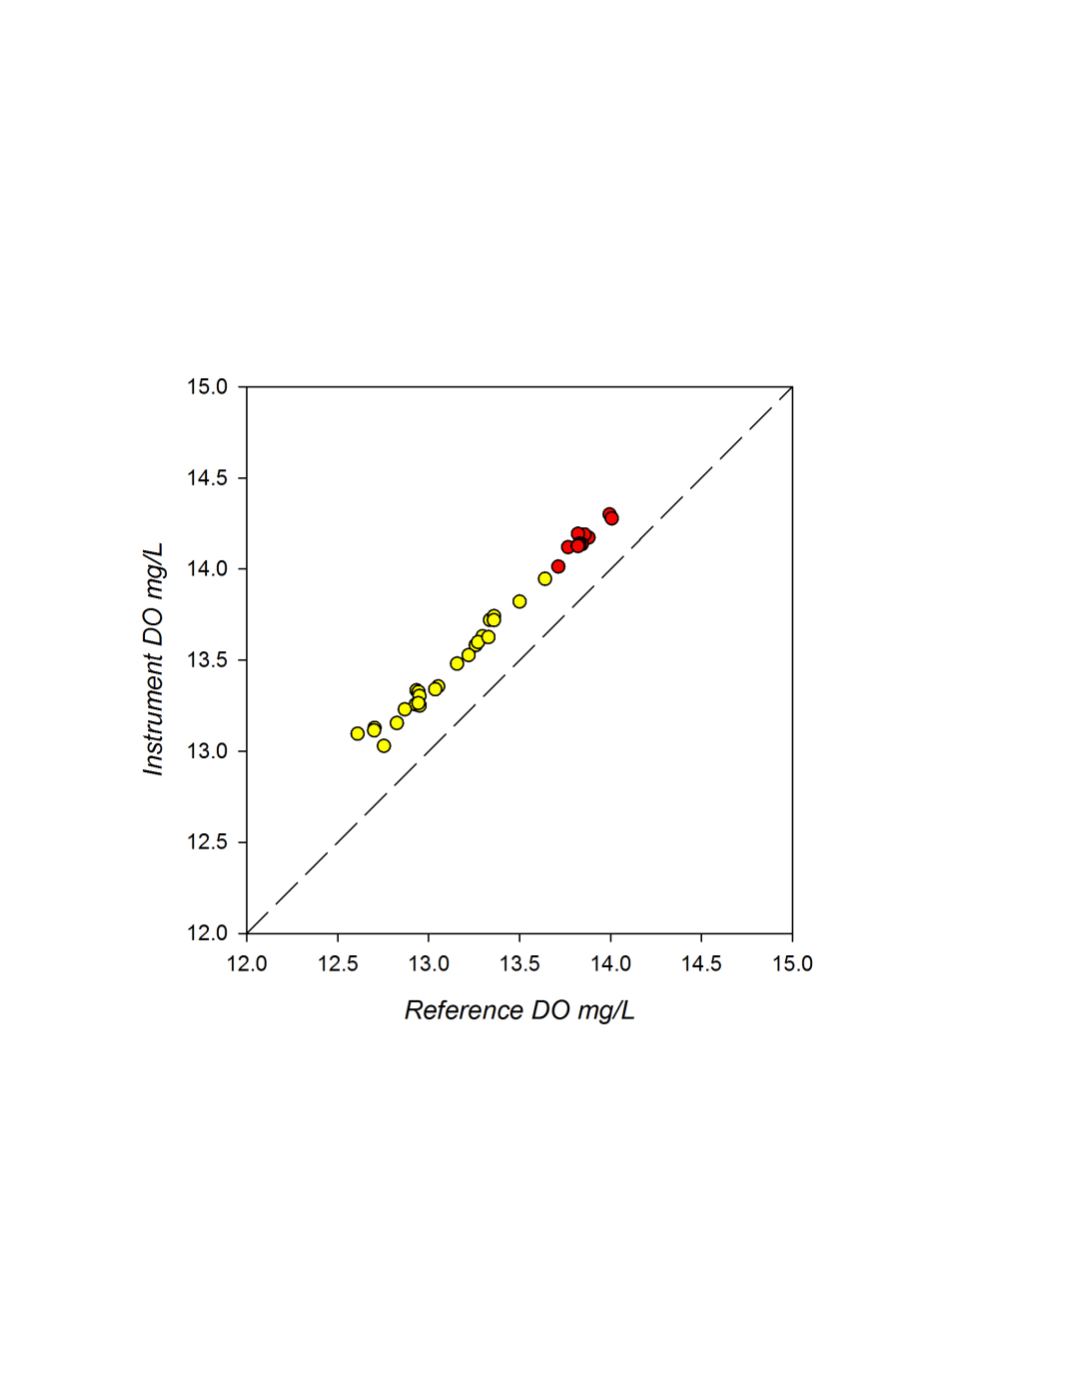
A cross-plot of the matched observations during the first month of deployment is given in
figure 3. Comparisons were limited to one month as a representation of a typical field deployment
and to focus on initial instrument offset versus impacts of biofouling during an extended
deployment. A linear regression of the data (r
2
= 0.99; p<0.0001) produced a slope of 0.947 and
intercept of 1.04, indicating an initial calibration offset. Additionally, there was a clear change in
instrument response even during the first 30 days so the relationship is not indicative of its overall
accuracy over the plotted range.
Figure 3
. MTU GLRI field response plot for the first month of deployment of SBS instrument compared to
reference DO samples. The plotted line represents a 1:1 correspondence. . (Yellow circles denote adjusted
reference values).