


 63 / 73

Ref. No. [UMCES] CBL 2016-010
ACT VS16-01
63
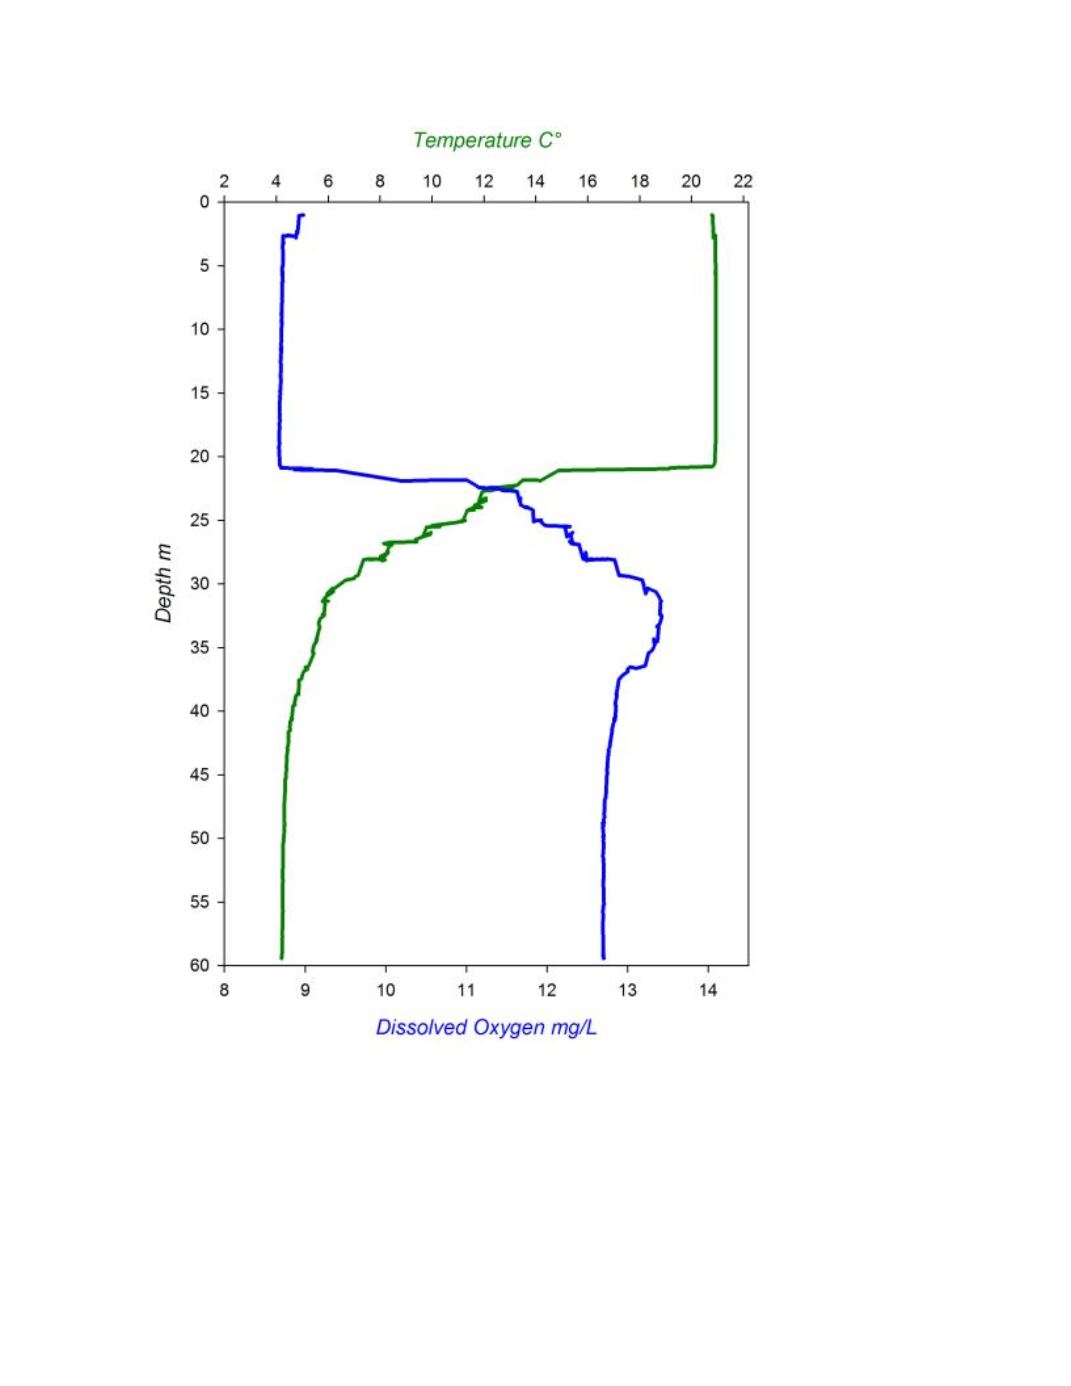
Figure 14. Temperature and DO concentration profiles for Lake Michigan. Values were obtained from the
average of multiple instruments sampling at 1s frequency. The hypolimnion was approximately 40m thick (the
rosette was stopped at 60m about 30m below the thermocline) and contained elevated DO levels of more than
12.6 mg/L.