


 58 / 73

Ref. No. [UMCES] CBL 2016-010
ACT VS16-01
58
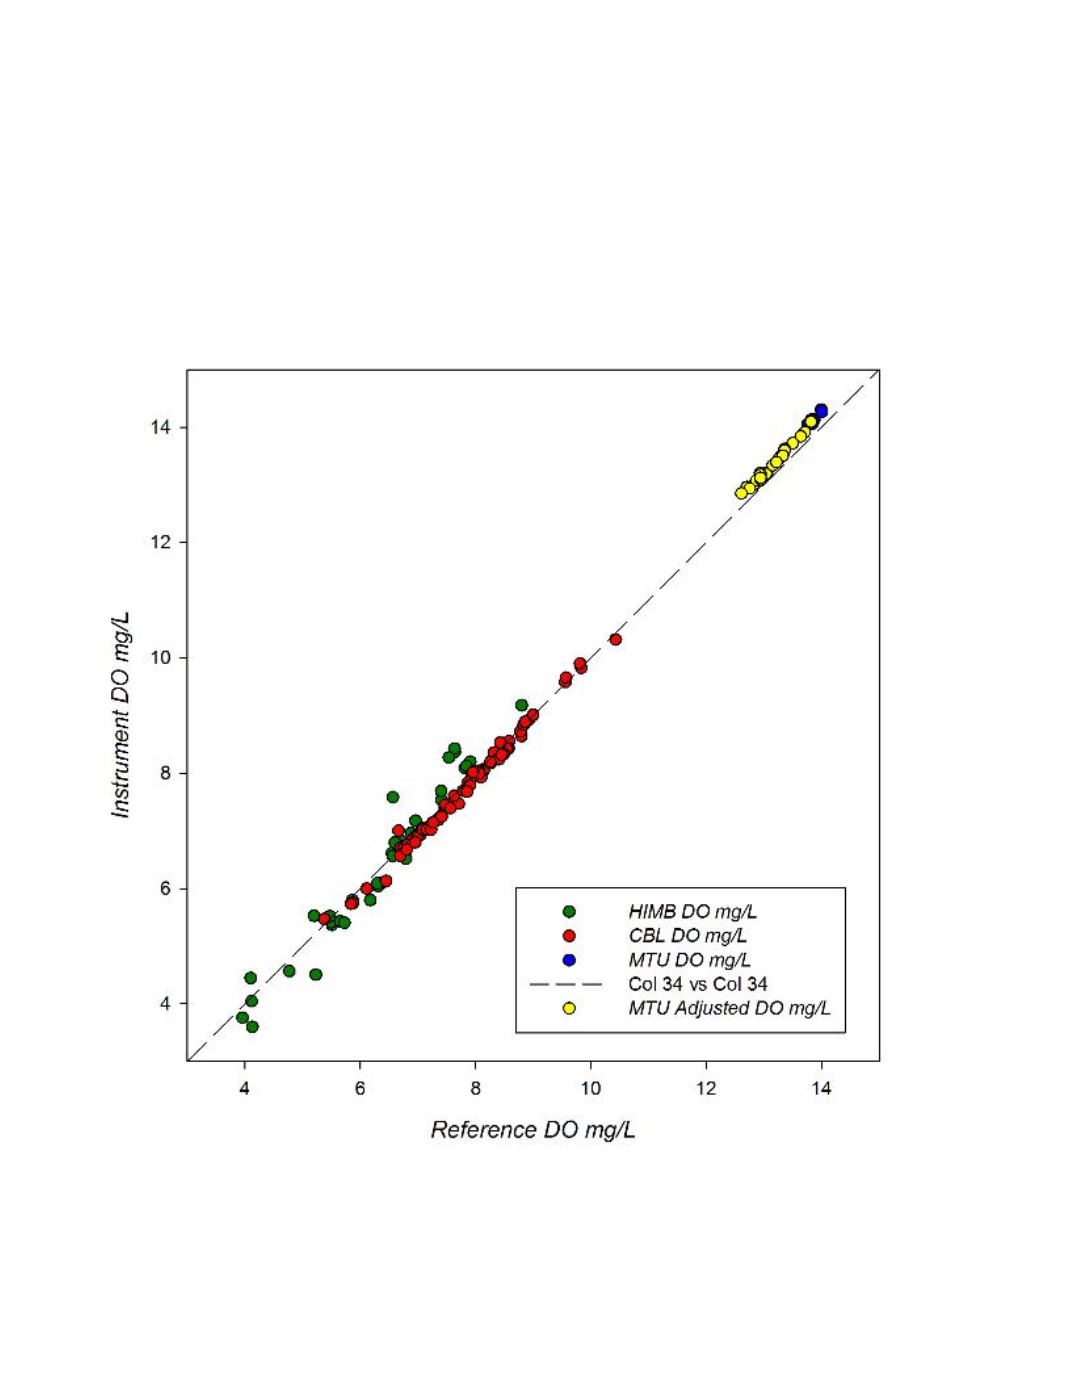
A global summary of instrument versus reference readings for all three deployment sites
is plotted in figure 10. The AroW-USB response curves were highly linear across all three salinity
ranges including freshwater, brackish water, and oceanic water. Good agreement between instrument
and reference measurements was observed over a wide range of DO conditions varying between 4 to
14 mg/L. There was a slightly higher offset for the cold freshwater test in Houghton, MI, and the
overall variability was slightly higher for the oceanic test in Kaneohe Bay. A linear regression of the
composited data (r
2
= 0.995; p<0.0001)) had a slope of 1.038 and intercept of -0.290.
Figure 10.
Global response plot for the AroW-USB instruments observed during the three ACT field trials.
Black dotted line represents a 1:1 correspondence.