


 56 / 73

Ref. No. [UMCES] CBL 2016-010
ACT VS16-01
56
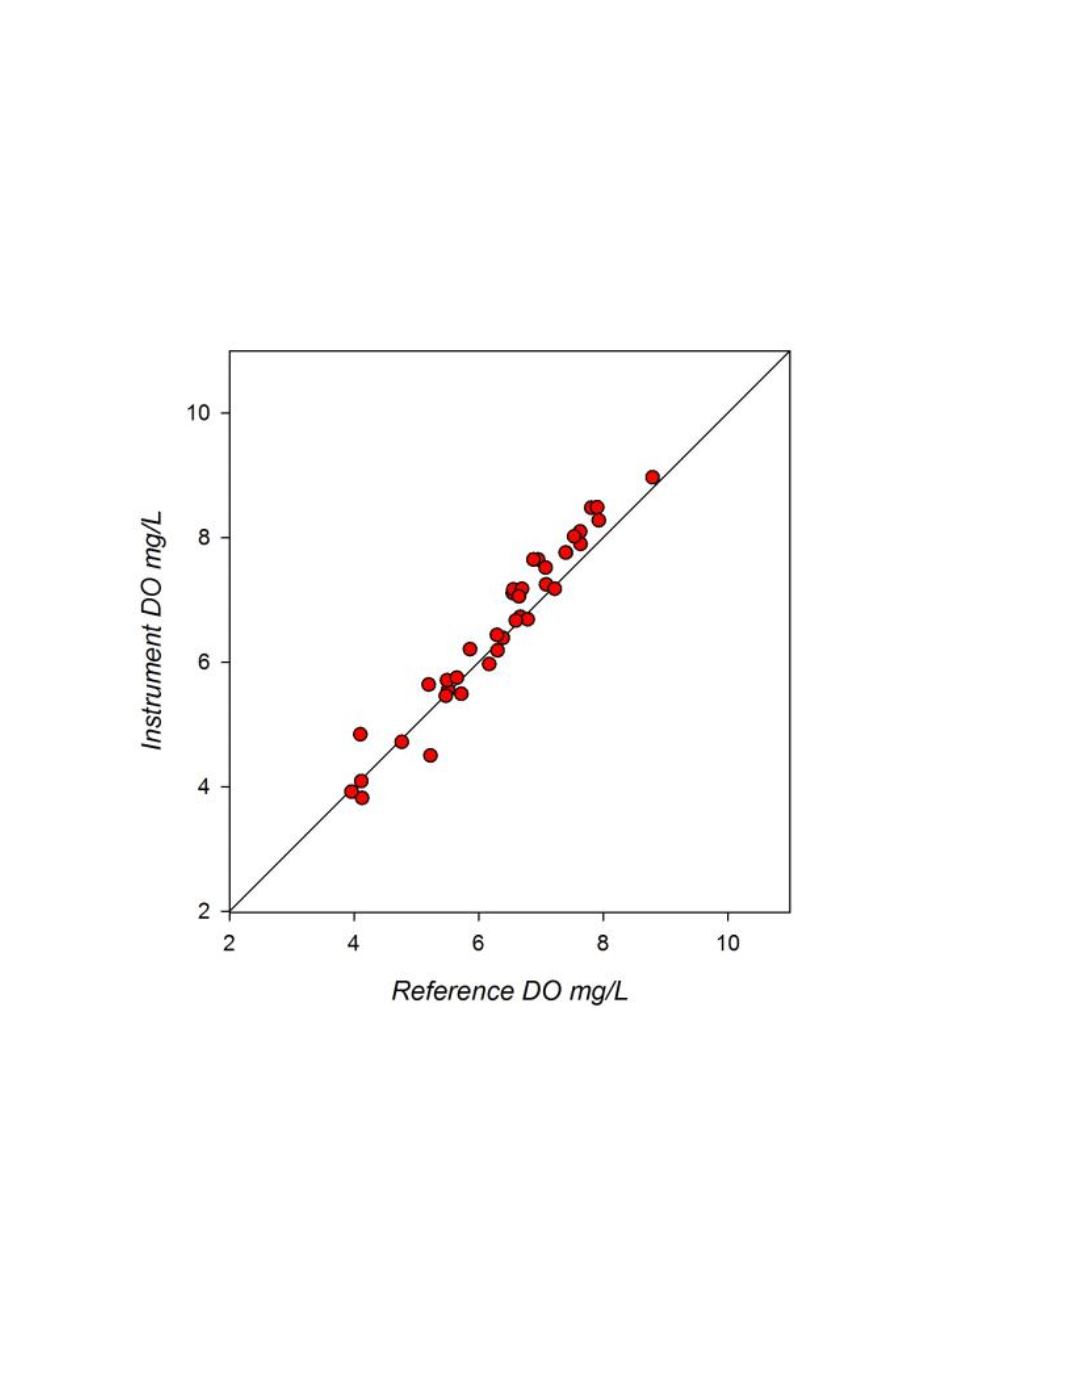
A cross-plot of the matched observations for the first month of deployment is given in figure 9.
Results reported after 11/25/16 were not included as they were deemed outside an acceptable range
from true ambient concentrations. A linear regression of the subset data (r
2
= 0.95) had a slope of 1.12
and intercept of -0.514
Figure 9.
HIMB field response plot of a JFE AroW-USB instrument compared to reference DO samples
determined by Winkler Titration. The plotted line represents a1:1 correspondence.