


 50 / 73

Ref. No. [UMCES] CBL 2016-010
ACT VS16-01
50
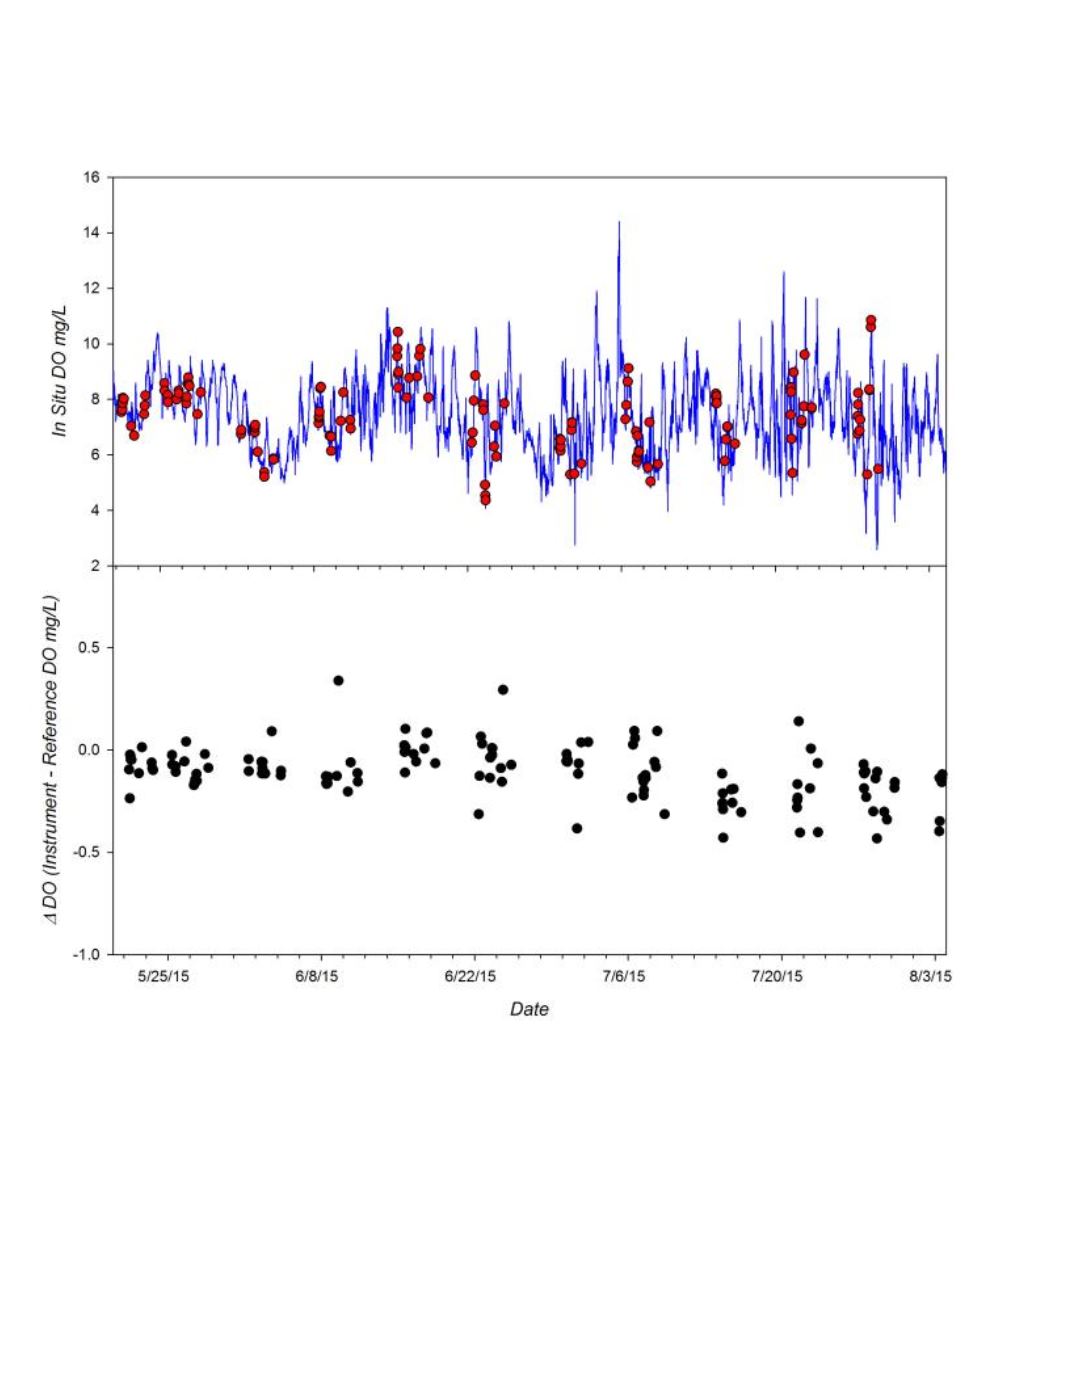
Figure 5.
Time series of DO measured by the AroW-USB during the 12 week CBL field trial.
Top Panel
:
Continuous DO recordings from instrument (blue line) and DO of adjacent grab samples determined by Winkler
titration (red circles).
Bottom Panel
: The difference in measured DO relative to reference samples (Instrument
DO mg/L – Ref DO mg/L) observed during deployment.