


 48 / 73

Ref. No. [UMCES] CBL 2016-010
ACT VS16-01
48
Moored Deployment at Chesapeake Biological Laboratory (CBL)
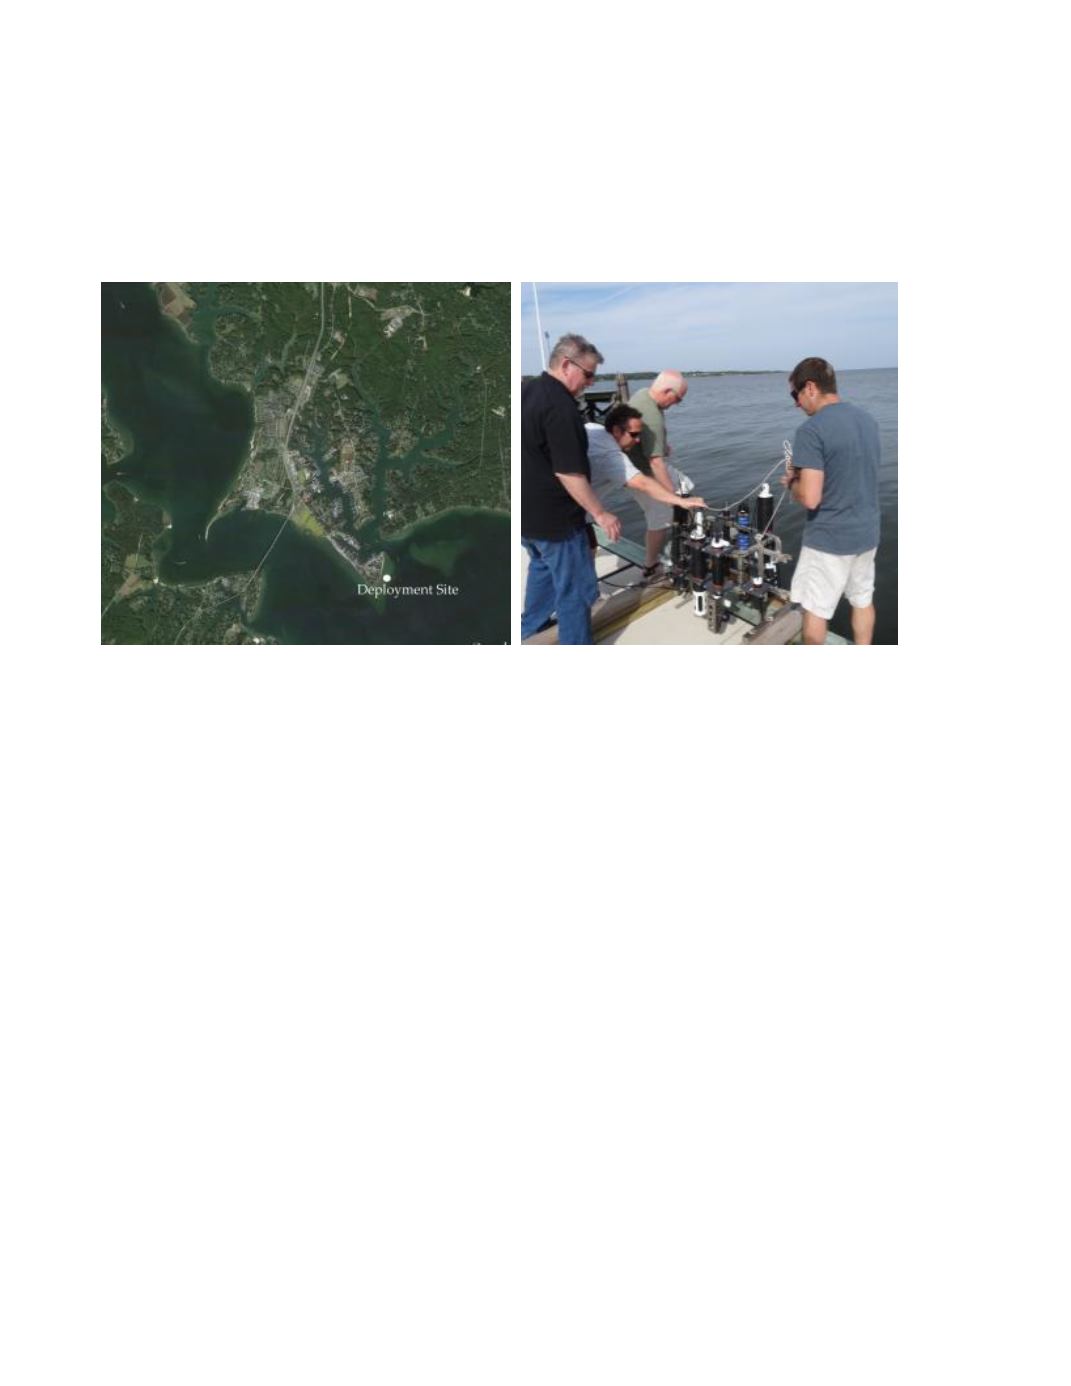
An eleven week moored field test was conducted in Chesapeake Bay from May 20 to August 5,
2015. The deployment was located at 38.32°N, 76.45°W attached to the side of a pier at the mouth of
the Patuxent River (Photo 3.) The site was brackish with an average water depth of the test site of 2.2
m.
Photo 3.
Aerial view of CBL deployment site (left) and duplicate sampling at mooring rack.
Time series results of ambient conditions for tidal height, temperature, and salinity are given in
figure 4. Temperature ranged from 19.2 to 30.1 and salinity from 4.7 to 13.7 over the duration of the
field test. The bottom panel displays the maximum difference recorded between all reference
thermistors (RBR Solo and SBE26) mounted at the same depth and different locations across the
mooring rack. The average temperature difference observed across the space of the mooring rack was
0.21 ±0.25
o
C, with a maximum of 3.26
o
C. Differences between instrument and reference readings
resulting from this variability should be minimized as the sampling bottle integrates across the mooring
space.
The JFE AroW-USB operated successfully over the entire 11 week deployment from May 20
through August 4 and generated 7270 observations based on its 15 minute sampling interval, for a data
completion result of 100%. Time series results of the AroW-USB and corresponding reference DO
results are given in the top panel of figure 5. Ambient DO measured by the AroW-USB ranged from
2.610 to 14.510 mg/L compared to the range captured by the reference measurements of 4.370 to
10.858 mg/L. The bottom panel presents the time series of the difference between the AroW-USB and
reference DO for each matched pair (n=142 observations out of a total of 142). The average and
standard deviation of the measurement difference for the deployment was -0.056 ±0.131 mg/L, with
the total range of differences between -0.375 to 0.392 mg/L. The drift rate of instrument offset,
estimated by linear regression was -0.002 mg/L/d, but with a low goodness of fit due to high variability
(r
2
=0.16). This rate would include any biofouling effects as well as any electronic or calibration drift.