


 36 / 59

Ref. No. [UMCES] CBL 2016-013
ACT VS16-04
36
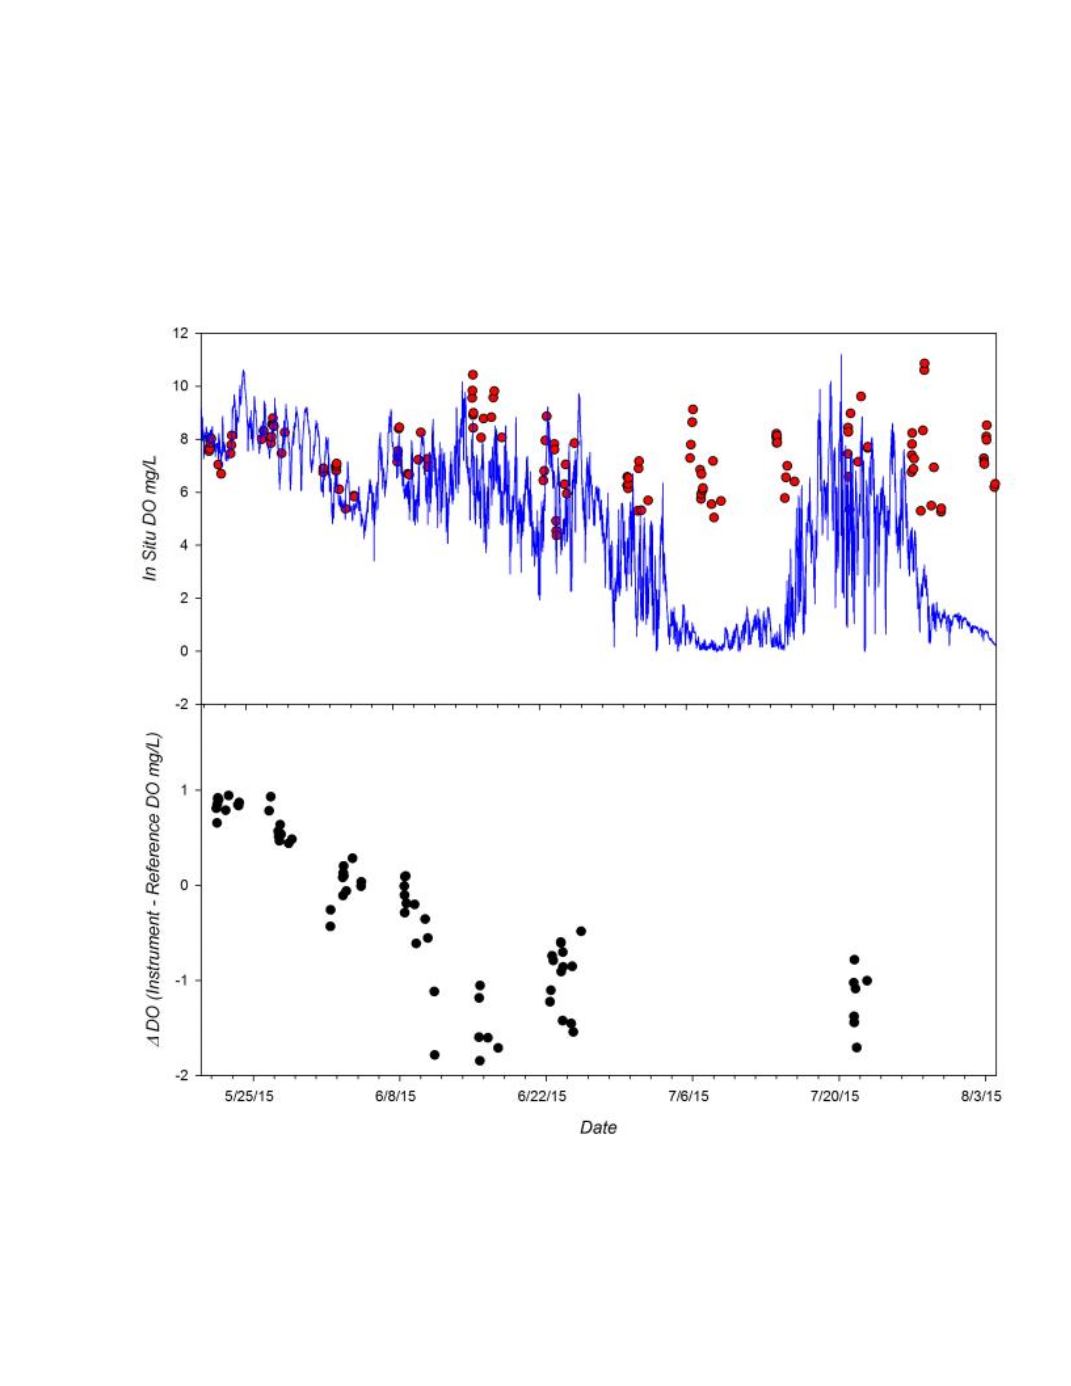
The calculated drift rate in instrument response for the entire deployment period (using the
accepted data in Fig 5) was -0.079 mg/L/d (r
2
= 0.77; p<0.001).
If we consider only the first 35
days of the deployment before any indication of a malfunction, the drift rate was -0.075 mg/L/d (r
2
= 0.67; p<0.001). In both cases the rate would include any biofouling effects as well as any
electronic or calibration drift.
Figure 5.
Time series of DO measured by the HOBO during the 12 week CBL field trial.
Top Panel
:
Continuous DO recordings from instrument (blue line) and DO of adjacent grab samples determined by
Winkler titration (red circles).
Bottom Panel
: Difference in measured DO relative to reference samples
(Instrument DO mg/L – Reference DO mg/L) observed during deployment.