


 31 / 59

Ref. No. [UMCES] CBL 2016-013
ACT VS16-04
31
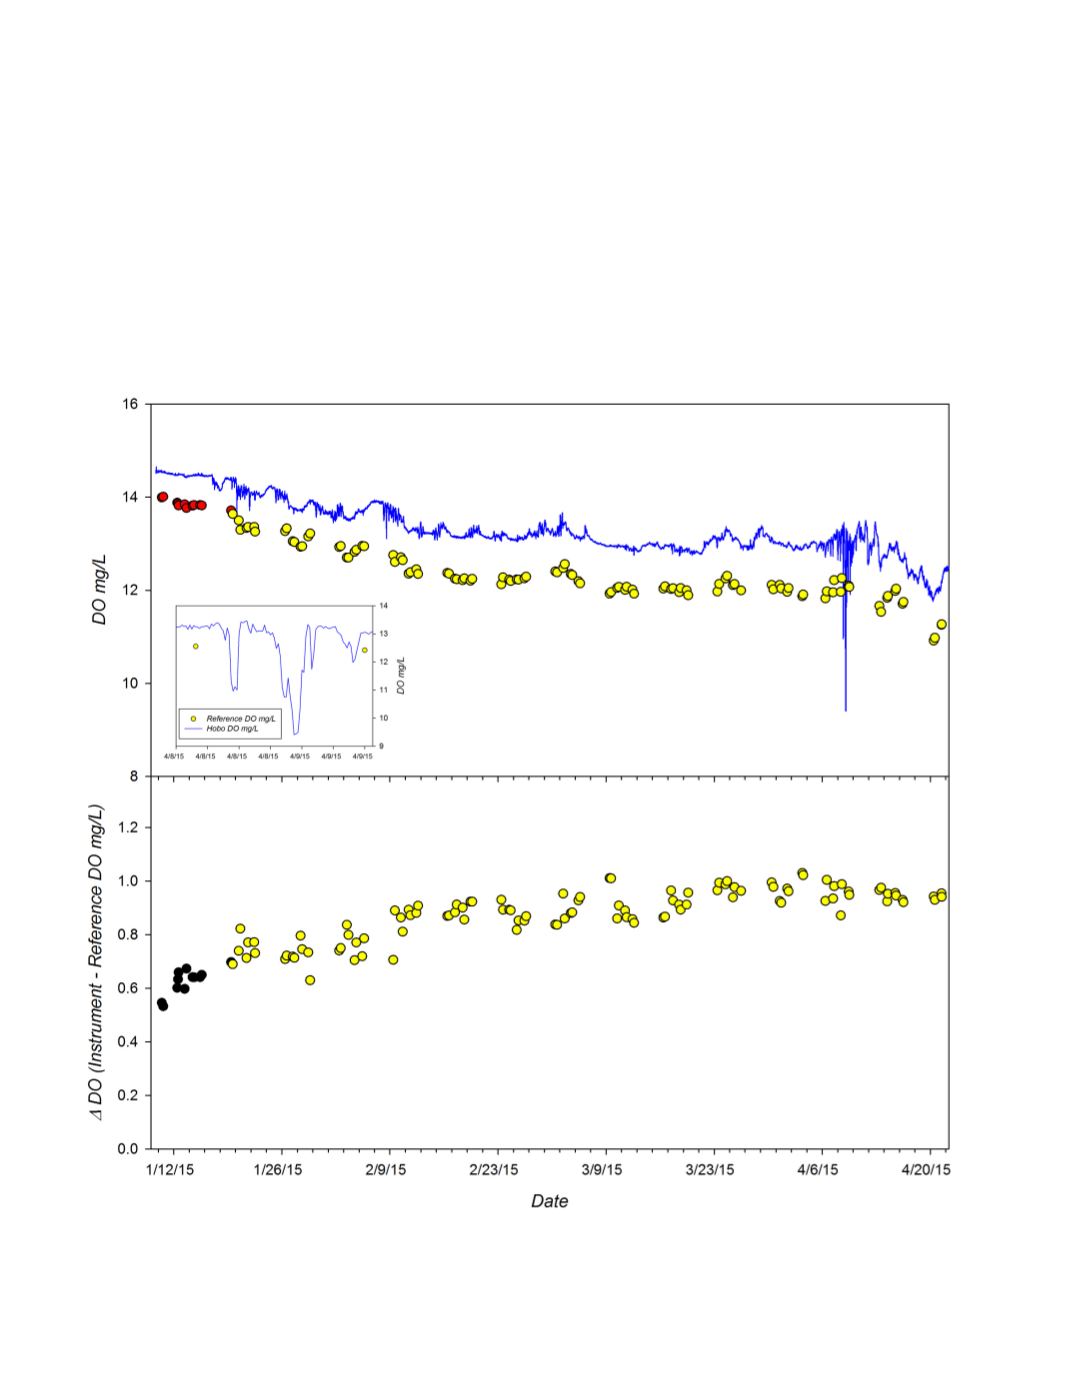
The time series of the difference between instrument and reference DO measurements for
each matched pair (n=118 observations) is given in the bottom panel of figure 2. The average and
standard deviation of the measurement difference over the total deployment was 0.855 ± 0.116
mg/L with a total range of 0.533 to 1.030 mg/L. The drift rate of instrument offset, estimated by
linear regression (r
2
=0.73; p<0.0001), was 0.003 mg/L/d. This rate would include any biofouling
effects as well as any electronic or calibration drift.
Figure 2.
Time series of DO measured dete
c
ted by HOBO U26 deployed during the 15 week Great Lakes
field trial.
Top Panel
: Continuous DO recordings from instrument (blue line) and DO of adjacent grab