


 34 / 59

Ref. No. [UMCES] CBL 2016-013
ACT VS16-04
34
Moored Deployment at Chesapeake Biological Laboratory (CBL)
An eleven week moored field test was conducted in Chesapeake Bay from May 20 to
August 5, 2015. The deployment was located at 38.32°N, 76.45°W attached to the side of a pier at
the mouth of the Patuxent River (Photo 3.) The site was brackish with an average water depth of
the test site was 2.2 m.
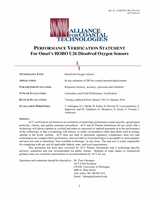
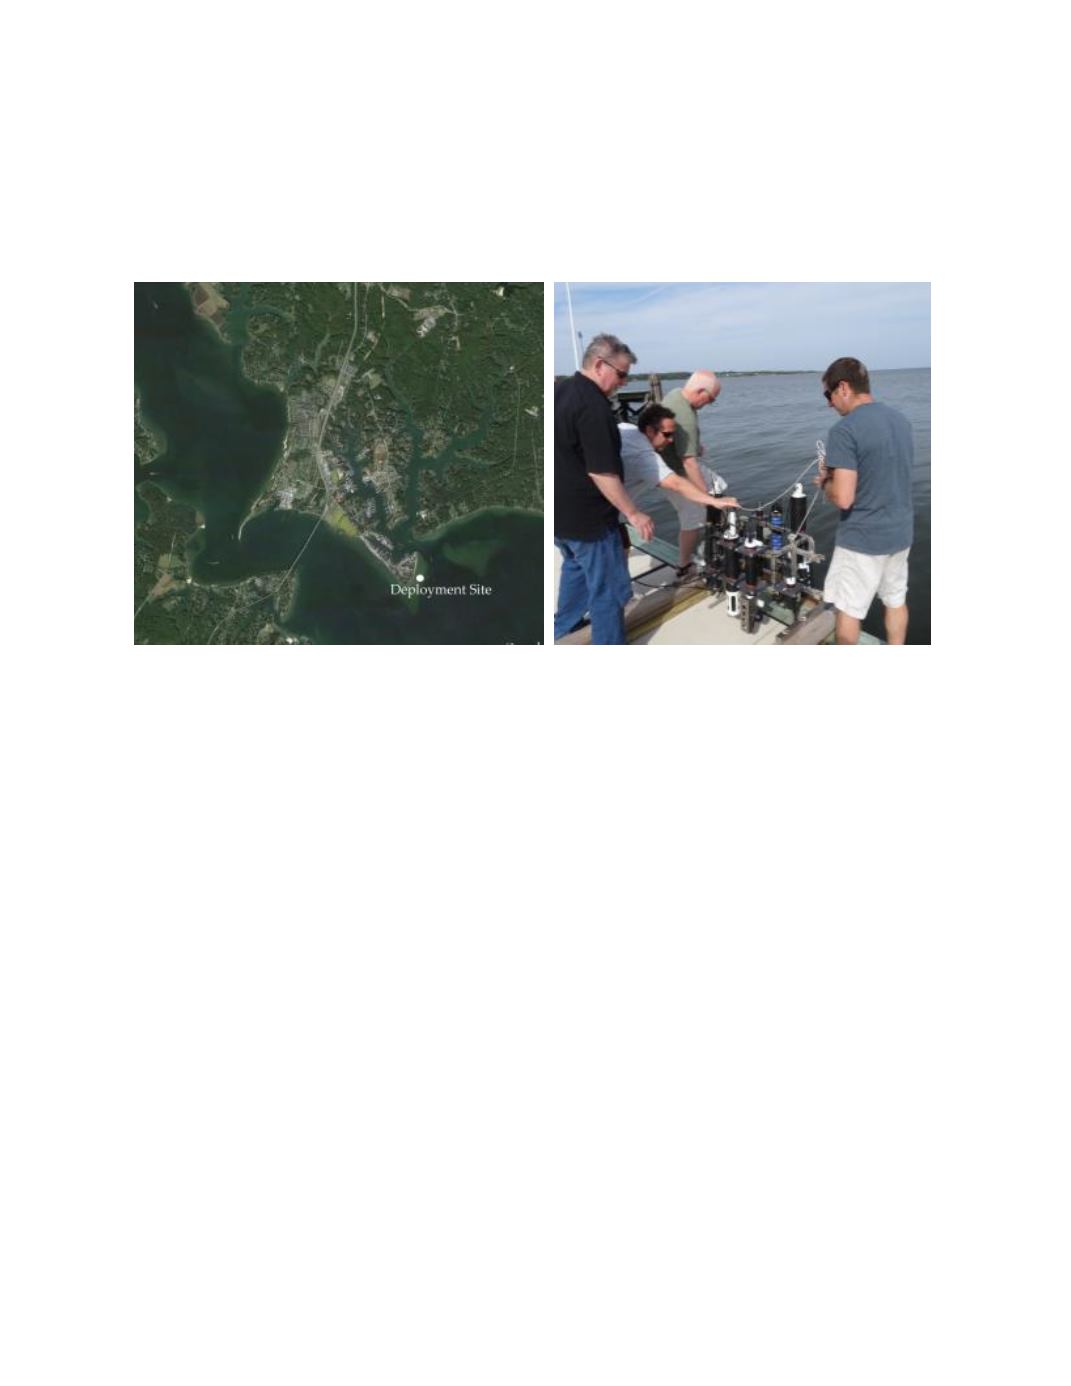
Photo 3.
Aerial view of CBL deployment site (left) and duplicate sampling at mooring rack.
Time series results of ambient conditions for tidal height, temperature, and salinity are
given in figure 4. Temperature ranged from 19.2 to 30.1 and salinity from 4.7 to 13.7 over the
duration of the field test. The bottom panel displays the maximum difference recorded between all
reference thermistors (RBR Solo and SBE26) mounted at the same depth and different locations
across the mooring rack. The average temperature difference observed across the space of the
mooring rack was 0.21 ±0.25
o
C, with a maximum of 3.26
o
C. Differences between instrument and
reference readings resulting from this variability should be minimized as the sampling bottle
integrates across the mooring space.
The HOBO U26 generated 7270 from a possible 7270 observations over the 11 week
deployment from May 20 through August 4 based on its 15 minute sampling interval. However,
only 5314 of the measurements were considered acceptable based on values that were less than 2
mg/L from any reference sample over a similar timeframe and from continuously monitored DO
from a nearby independent data sonde. The accepted data resulted in a data completion rate for
this deployment of 73%. Time series results of the HOBO U26 and corresponding reference DO
results are given in the top panel of figure 5. Ambient DO measured by the HOBO ranged from
2.00 to 11.81 mg/L compared to the range captured by the reference measurements of 4.370 to
10.85 mg/L. The bottom panel presents the time series of the difference between the HOBO and
reference DO for each matched pair (limited to ±2.0 mg/L; n=75 observations out of a total of
142). The average and standard deviation of the measurement difference for the deployment was
-0.211 ±0.860 mg/L, with the total range of differences between -1.85 to 0.94 mg/L.