


 40 / 59

Ref. No. [UMCES] CBL 2016-013
ACT VS16-04
40
deployment period but the scatter resulted in a very low goodness of fit in the regression. This rate
would include any biofouling effects as well as any electronic or calibration drift.
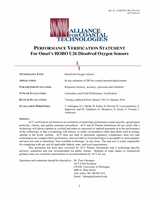
Figure 7.
Environmental conditions encountered during the 4 month HIMB deployment on the fringing reef flat off
Coconut Island Test sensor array deployed at 1 m fixed depth, variation in local tidal heights indicate active water
flow around instrument (
Top Panel
). Variation in salinity (red) and temperature (green) at depth of instrument sensor
detected by an SBE 26 and two RBR Solo thermistors (
Middle Panel
). Temperature range determined from max-min
temperatures detected by RBR thermistors spanning instrument sensor array (
Bottom Panel
).