


 44 / 59

Ref. No. [UMCES] CBL 2016-013
ACT VS16-04
44
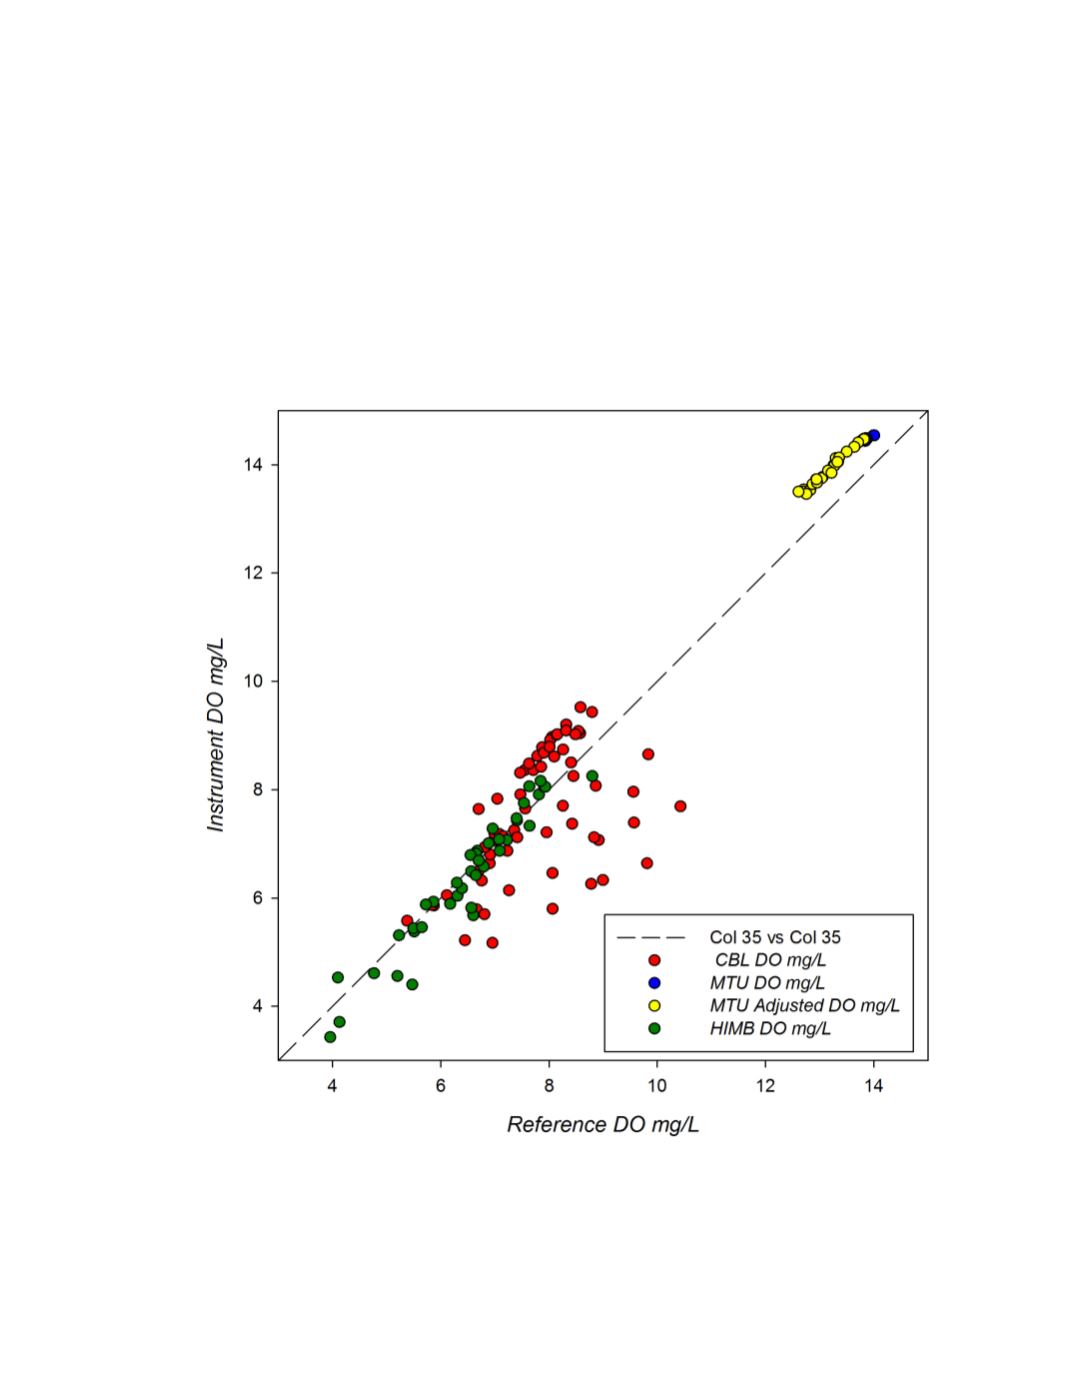
A global summary of instrument versus reference readings for all three field deployment
sites are plotted in figure 10. Although there was significant scatter at CBL (likely due to high
biofouling), the HOBO U26 response was fairly linear over all three salinity ranges including
freshwater, brackish water, and oceanic water. The response curves were generally consistent
across the concentration range within a given test site as well as over the wide range of DO
conditions (4 - 14 mg/L) across sites regardless of temperature or salinity. A linear regression of
the subset data (r
2
= 0.94; p<0.0001)) had a slope of 1.106 and intercept of -0.895.
Figure 10.
Global response plot for the HOBO U26 instruments observed during the three ACT field trials.
Black dotted line represents a 1:1 correspondence.