


 37 / 59

Ref. No. [UMCES] CBL 2016-013
ACT VS16-04
37
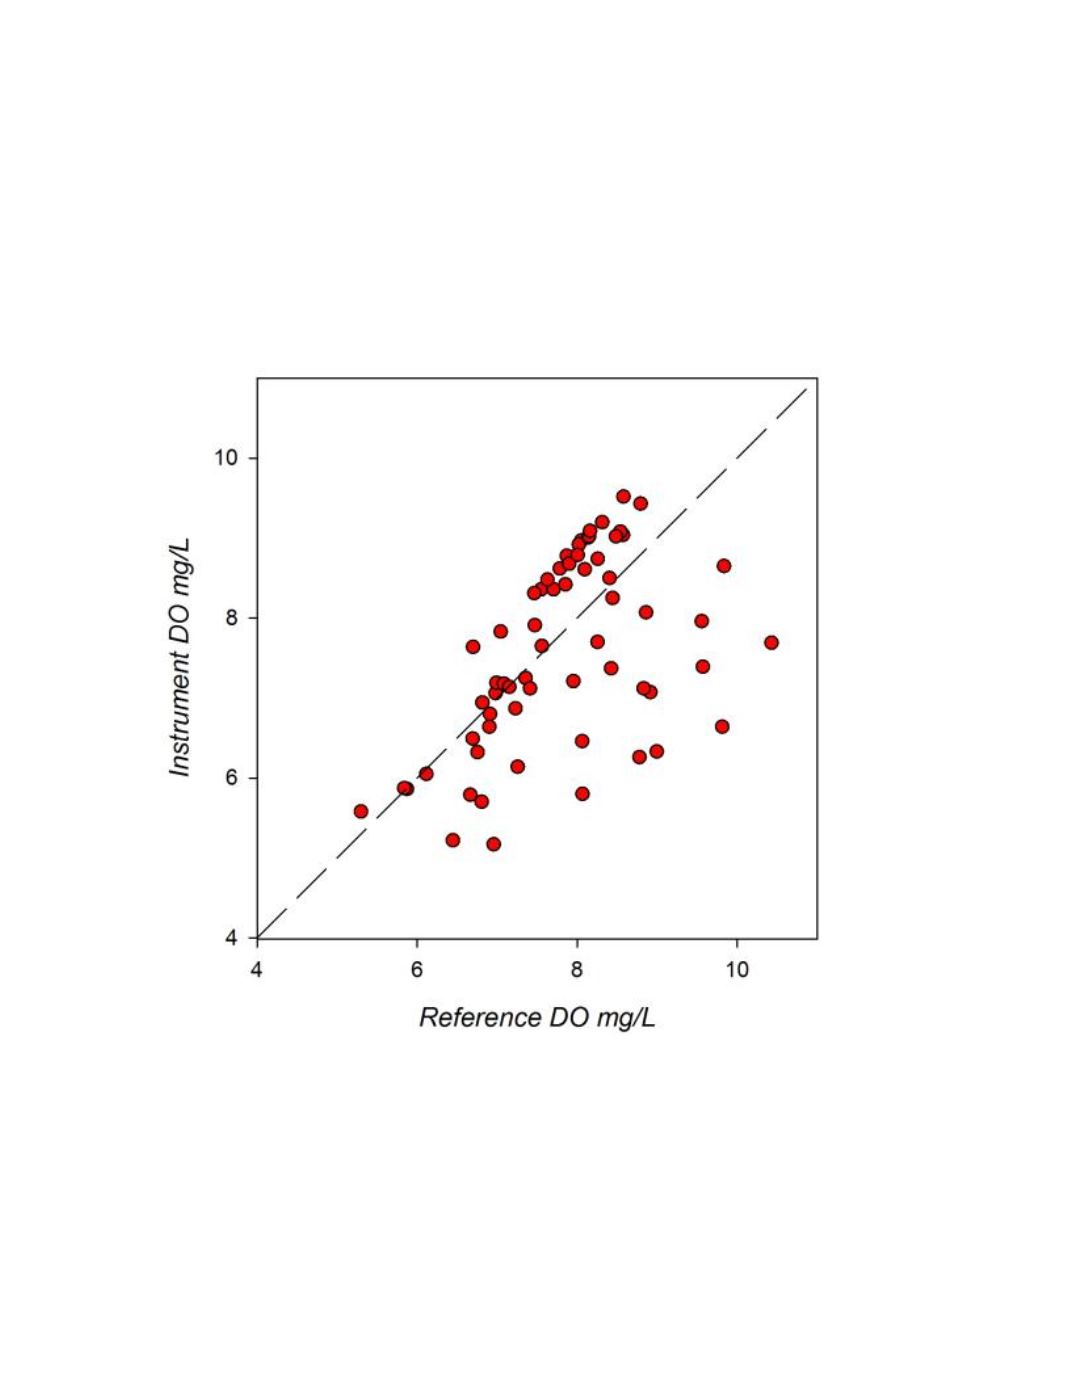
A cross-plot of all matched observations for the first month of the deployment is given in figure 6.
Comparisons were limited to one month as a representation of a typical field deployment and to
focus on initial instrument offset versus impacts of biofouling during an extended deployment.
However, it should be noted results include data that were outside of the 2 mg/L acceptance criteria
and the high degree of scatter indicates the instrument was impacted by biofouling within this first
30 days (see photo 4 below). A linear regression of the data (r
2
= 0.262; p<0.001) produced a slope
of 0.594 and intercept of 2.93.
Figure 6.
CBL field response plot for HOBO U26 compared to reference DO samples. The plotted line
represents a 1:1 correspondence.