


 32 / 59

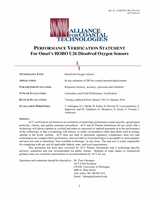
Ref. No. [UMCES] CBL 2016-013
ACT VS16-04
32
samples determined by Winkler titration (red circles, yellow circles represent adjusted reference values).
Bottom Panel
: Difference in measured DO relative to reference samples (Instrument DO mg/L – Reference
DO mg/L) observed during deployment.
Insert:
Close up of excursion that occurred 4/8-4/9. No reference
samples were collected during this time period.
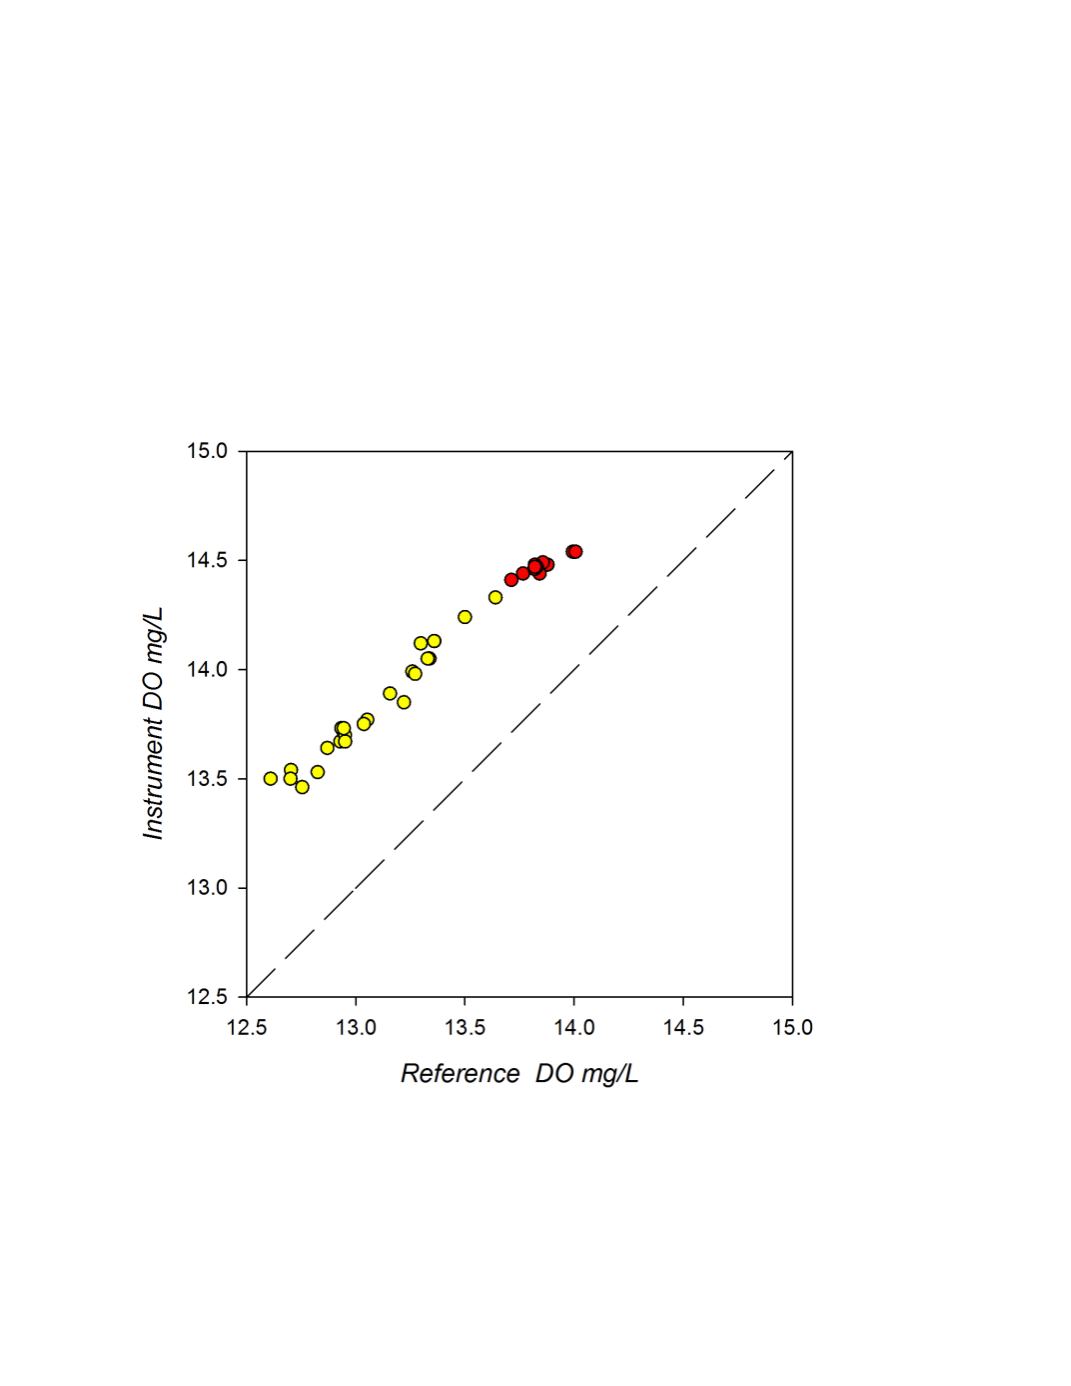
A cross-plot of the matched observations during the first month of deployment is given in
figure 3. Comparisons were limited to one month as a representation of a typical field deployment
and to focus on initial instrument offset versus impacts of biofouling during an extended
deployment. A linear regression of the instrument versus reference measurements (r
2
= 0.98;
p<0.0001) produced a slope of 0.855 and intercept of 2.64 indicating mostly an initial calibration
offset. The calibration offset was also noticed in the original tank test before deployment.
Figure 3
. MTU GLRI field response plot for the first month of deployment of HOBO instrument compared
to reference DO samples. The plotted line represents a 1:1 correspondence. (Yellow circles denote adjusted
reference values).