


 35 / 59

Ref. No. [UMCES] CBL 2016-015
ACT VS16-06
35
Moored Deployment at Chesapeake Biological Laboratory (CBL)
An eleven week moored field test was conducted in Chesapeake Bay from May 20 to
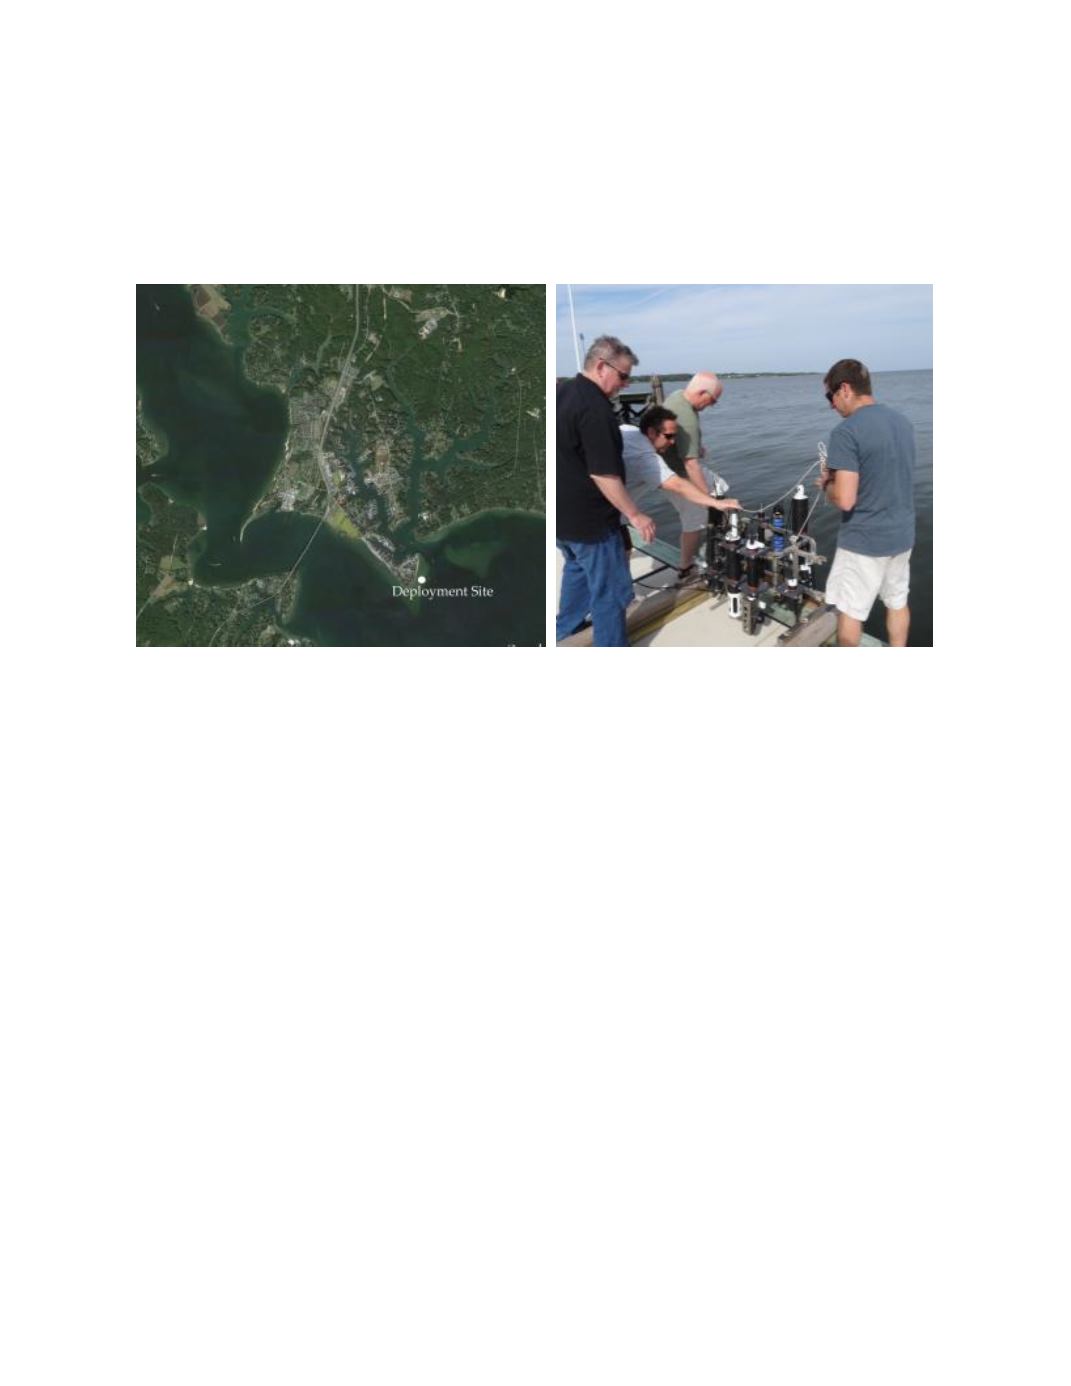
August 5, 2015. The deployment was located at 38.32°N, 76.45°W attached to the side of a pier at
the mouth of the Patuxent River (Photo 3.) The site was brackish with an average water depth of
the test site was 2.2 m.
Photo 3.
Aerial view of CBL deployment site (left) and duplicate sampling at mooring rack.
Time series results of ambient conditions for tidal height, temperature, and salinity are
given in figure 4. Temperature ranged from 19.2 to 30.1 and salinity from 4.7 to 13.7 over the
duration of the field test. The bottom panel displays the maximum difference recorded between all
reference thermistors (RBR Solo and SBE26) mounted at the same depth and different locations
across the mooring rack. The average temperature difference observed across the space of the
mooring rack was 0.21 ±0.25
o
C, with a maximum of 3.26
o
C. Differences between instrument and
reference readings resulting from this variability should be minimized as the sampling bottle
integrates across the mooring space.
The EXO2 sonde had two brief periods of interruption on July 8th and July 12th, and then
quit operating permanently on July 31
st
, approximately 4 days before the end of the 11 week
deployment which covered from May 20 through August 4. The EXO2 generated 6027 from a
possible 7270 observations based on its 30 minute sampling interval, for a data completion result
of 83%. Time series results of the EXO2 and corresponding reference DO results are given in the
top panel of figure 5. Ambient DO measured by the EXO2 ranged from 3.11 to 14.85 mg/L
compared to the range captured by the reference measurements of 4.370 to 10.858 mg/L. The
bottom panel presents the time series of the difference between the EXO2 and reference DO for
each matched pair (limited to ± 2.0 mg/L; n=119 comparisons out of a total of 142, (21 missing
data points and 2 comparisons ≥ 2.0 mg/L). The average and standard deviation of the
measurement difference for the deployment was 0.151 ±0.220 mg/L, with the total range of
differences between -0.689 to 0.786 mg/L. There was no significant trend in the drift rate of
instrument offset (slope = 0.0007 mg/L/d; r
2
=0.002) over the deployment period. This rate would
include any biofouling effects as well as any electronic or calibration drift.