


 43 / 63

Ref. No. [UMCES] CBL 2015-013
ACT VS15-06
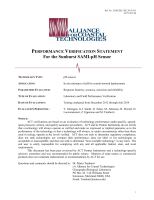
Figure 17.
Environmental conditions encountered during the 1 month freshwater deployment adjacent to the NOAA
GLERL Pier. Test sensor array deployed on bottom, variation in local water depth measured as PSIA by an SBE
26PLUS Wave gauge indicating active water flow around instrument (
Top Panel
). Variation in salinity (green) and
temperature (red) at depth of instrument sensor detected by an SBE26 and two RBR Solo thermistors. (
Middle Panel
).
Temperature range determined from max-min temperatures detected by RBR and SBE thermistors spanning instrument
sensor array (
Bottom Panel
). A significant storm with winds over 25 mph event contributed to higher variation in
environmental conditions near end of deployment period.
43