


 39 / 63

Ref. No. [UMCES] CBL 2015-013
ACT VS15-06
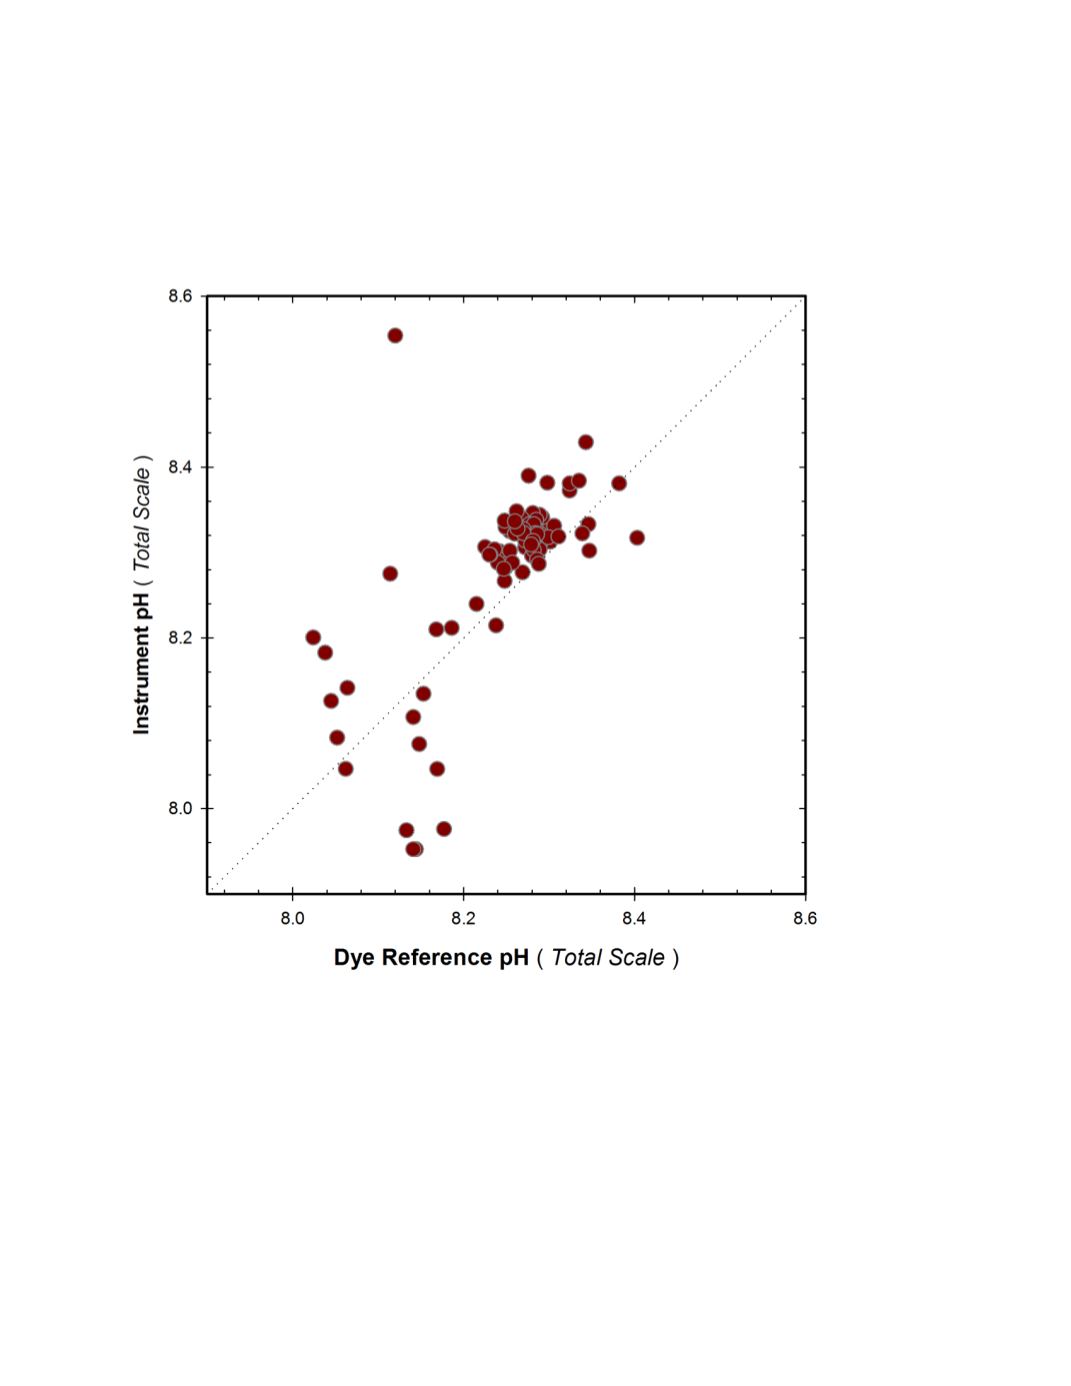
A cross-plot of the matched observations is given in figure 16. The linear regression of
the data from the initial, well performing period, was statistically significant (p<0.001, r
2
= 0.40)
with a slope of 0.647 and intercept of 2.895.
Figure 16.
CBL field response plot a SAMI-pH(mCP) instrument compared to reference pH
Total
samples.
Fine dotted line represents 1:1 correspondence, as pH
Total
scale is reported by both the SAMI-pH
instrument and the dye reference method.
39