


 45 / 63

Ref. No. [UMCES] CBL 2015-013
ACT VS15-06
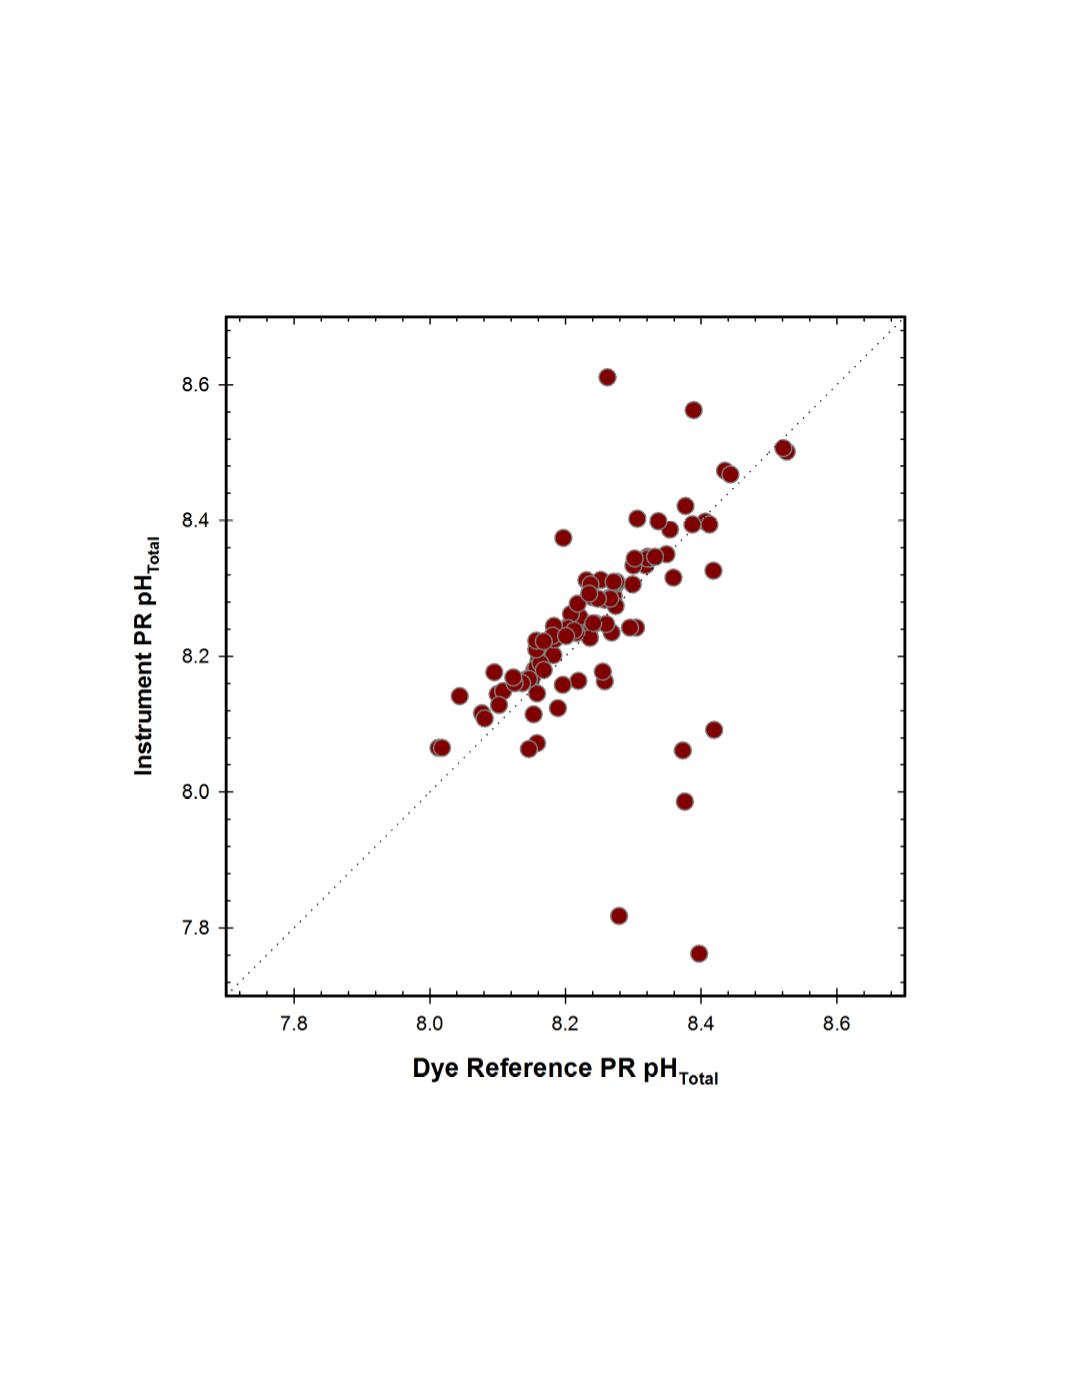
Figure 19.
GLERL field response plot for a SAMI-pH(PR) instrument compared to reference pH
Total
samples. Fine dotted line represents 1:1 correspondence, as pH
Total
scale is reported by both the SAMI-pH
instrument and the dye reference method.
45