


 48 / 63

Ref. No. [UMCES] CBL 2015-013
ACT VS15-06
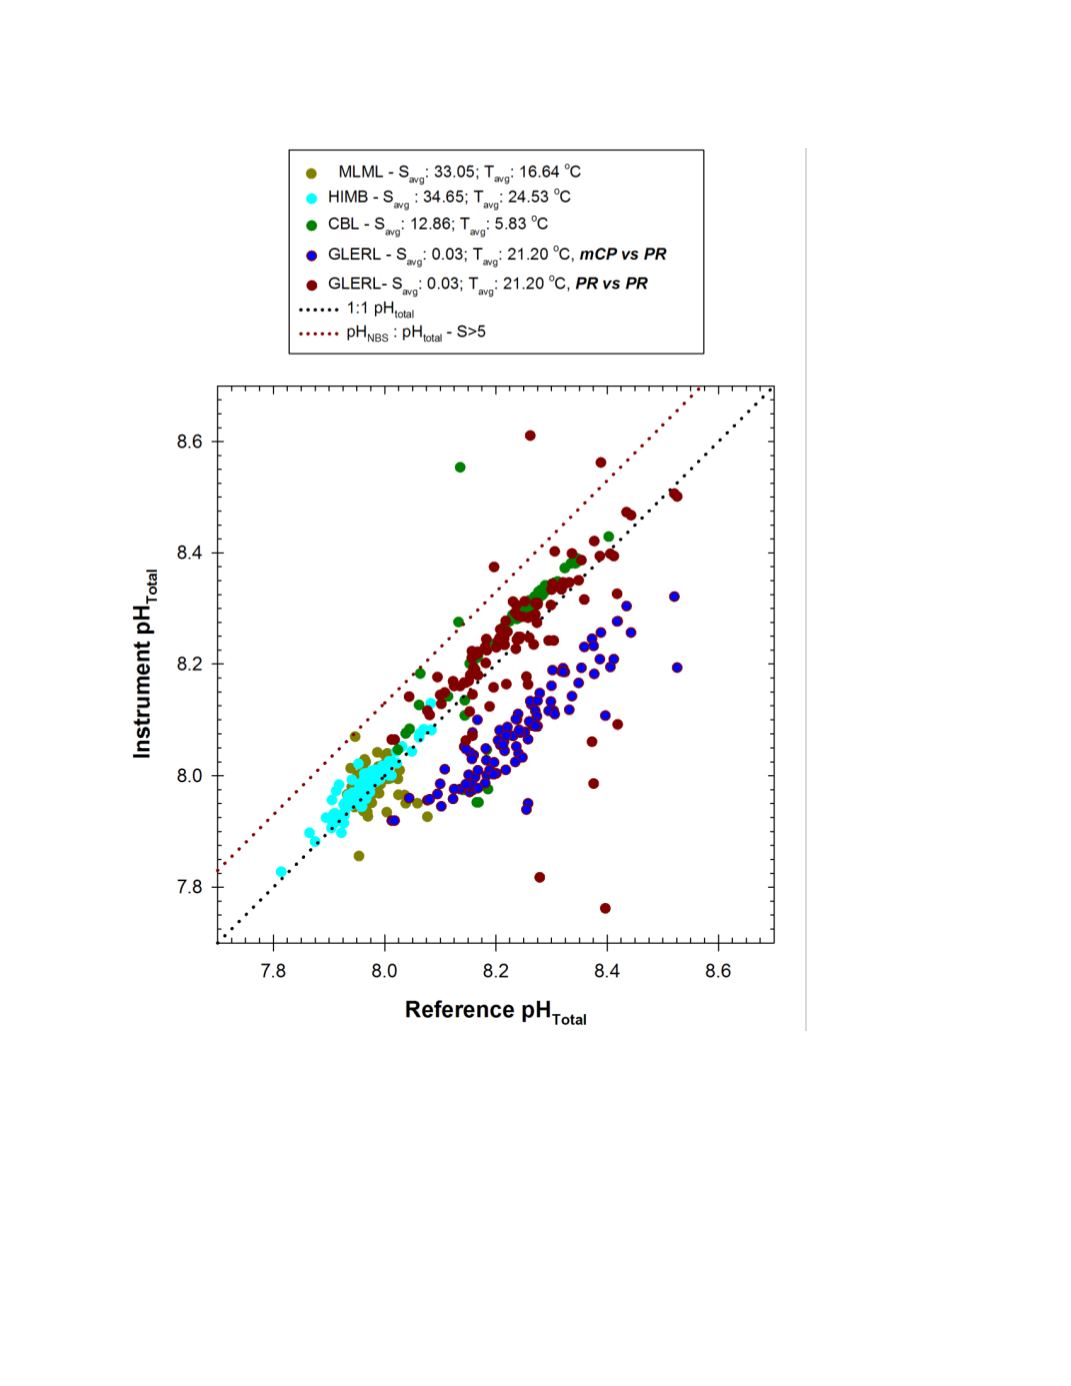
Figure 22.
Global response plot for SAMI-pH(mCP) and SAMI-pH(PR) observed during ACT field
trials. Fine dotted line represents 1:1 correspondence, coarse dotted line represents correspondence
predicted based on difference between pH
NBS
and pH
Total
in seawater (pH
NBS
= pH
Total
+ 0.13).
48